Fig. 8
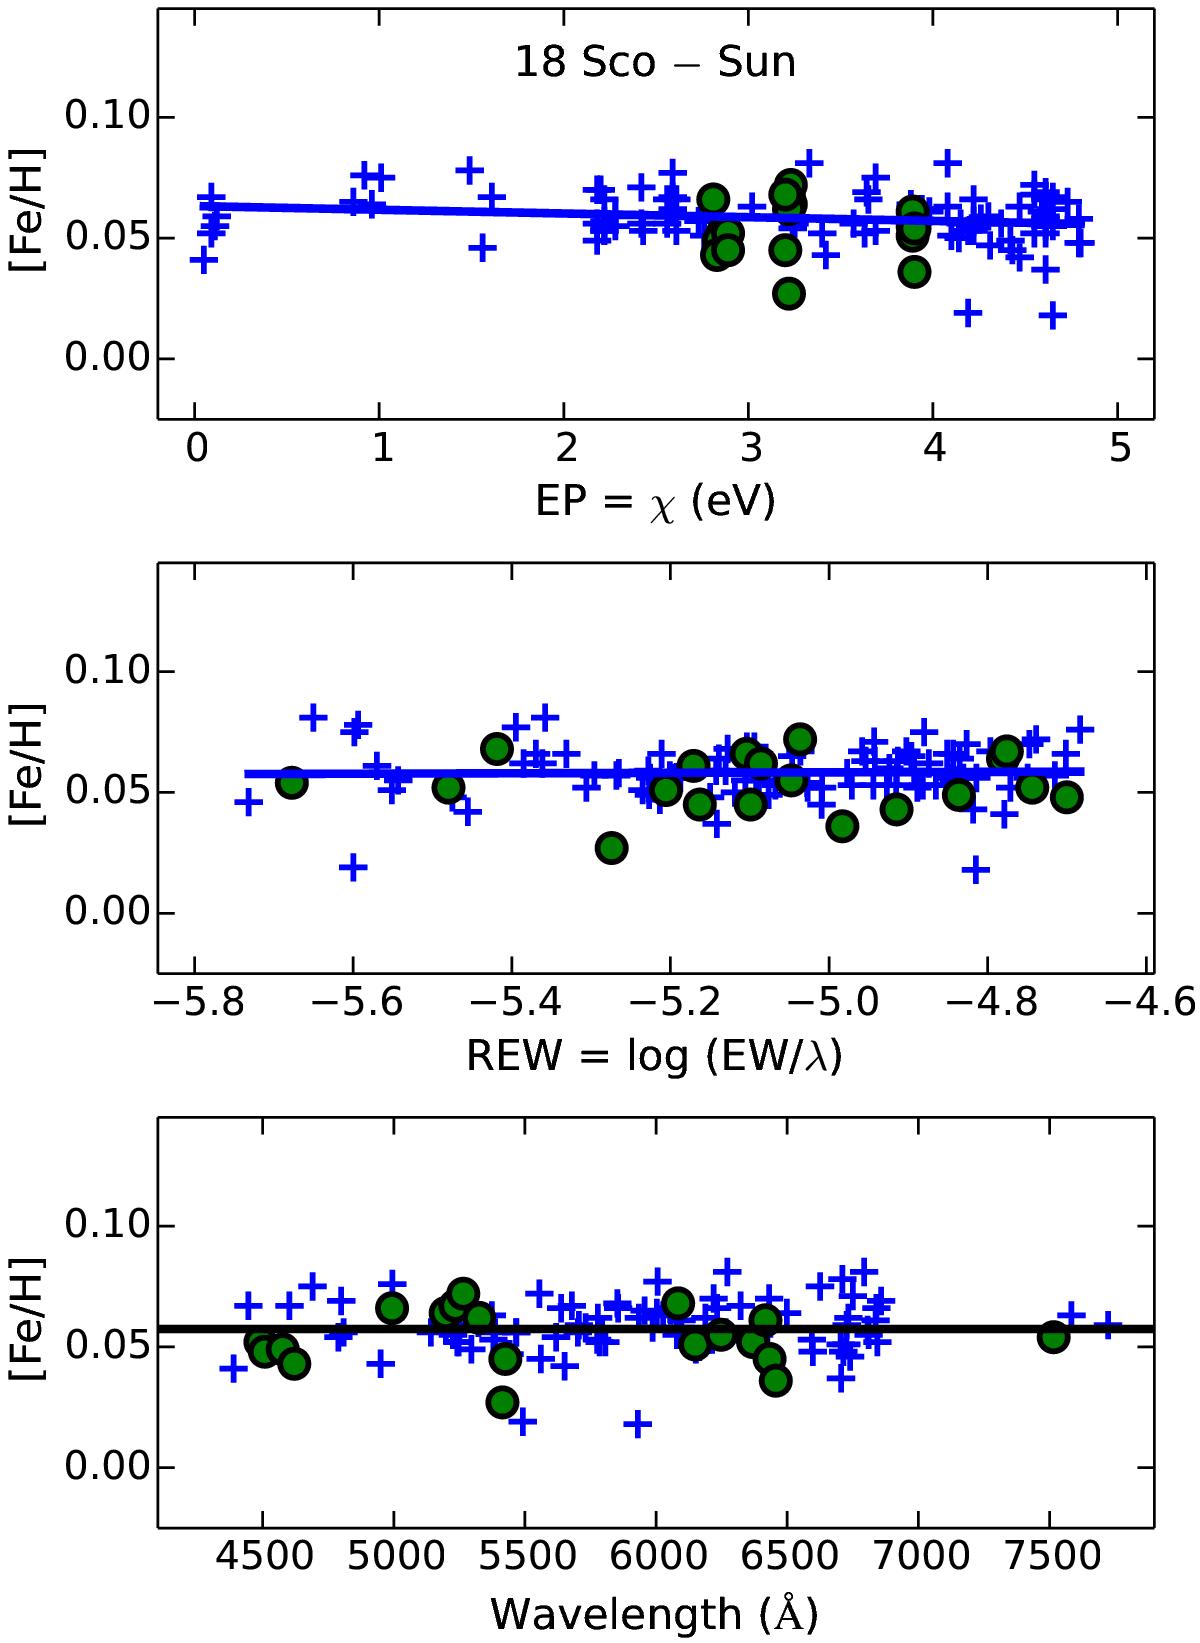
Line-to-line relative iron abundance of 18 Sco as a function of excitation potential (top panel), reduced EW (middle panel), and wavelength (bottom panel). Crosses (circles) are Fe i (Fe ii) lines. The solid lines in the top and middle panels are linear fits to the Fe i data. In the bottom panel, the solid line is a constant which corresponds to the average iron abundance of this star.
Current usage metrics show cumulative count of Article Views (full-text article views including HTML views, PDF and ePub downloads, according to the available data) and Abstracts Views on Vision4Press platform.
Data correspond to usage on the plateform after 2015. The current usage metrics is available 48-96 hours after online publication and is updated daily on week days.
Initial download of the metrics may take a while.