Fig. 8
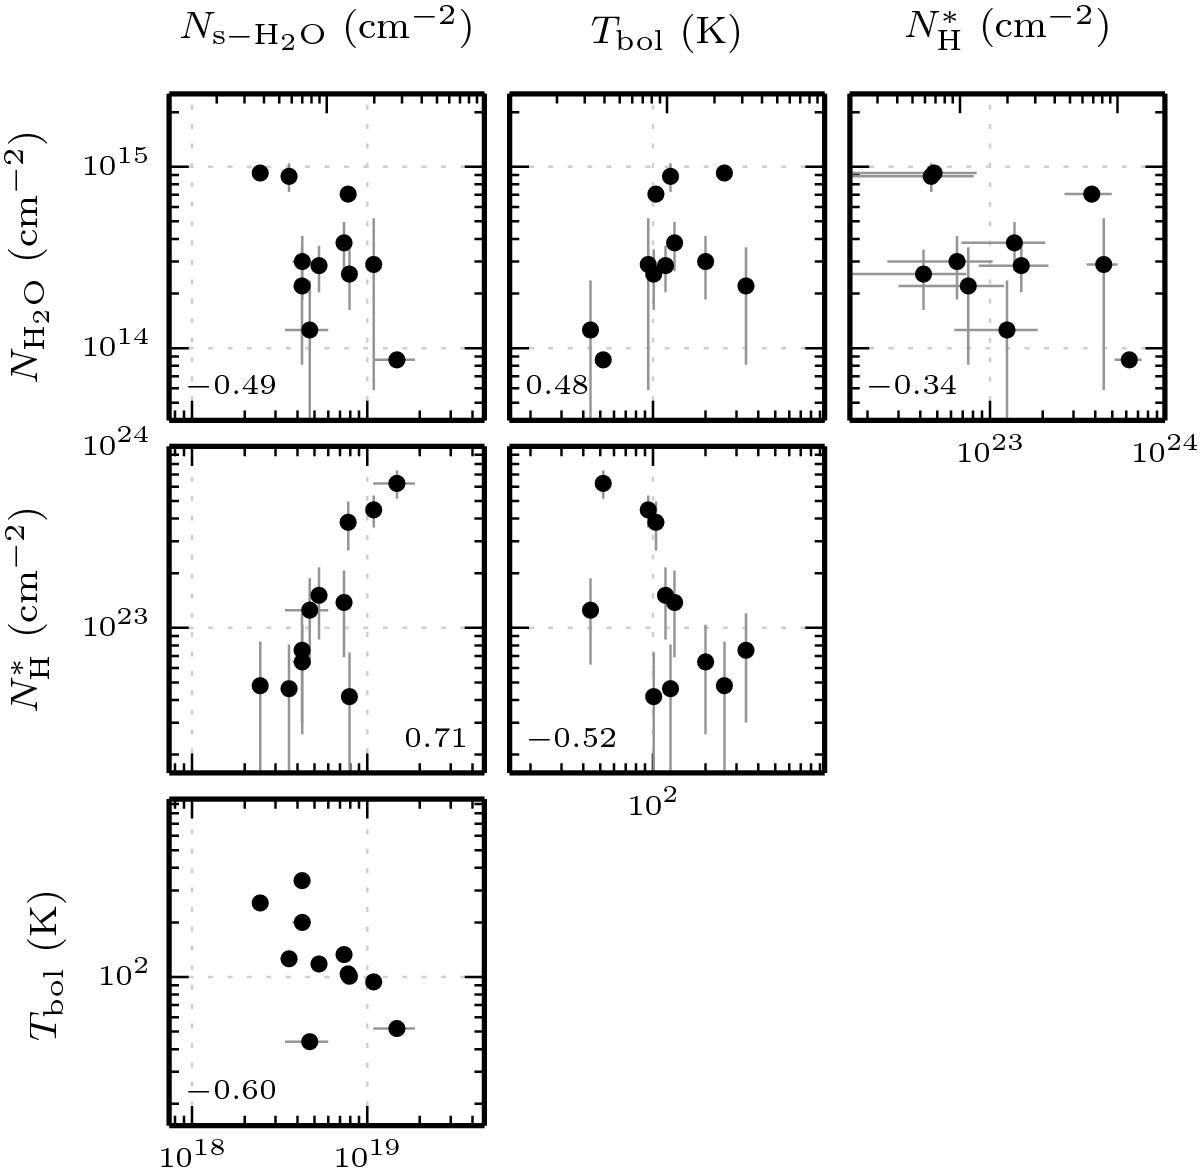
Correlation of the bolometric temperature Tbol and hydrogen column density NH with the column densities of water vapour NH2O and water ice Ns - H2O in the water freeze-out zone. The number in the corner depicts the Pearson sample correlation coefficient r.
Current usage metrics show cumulative count of Article Views (full-text article views including HTML views, PDF and ePub downloads, according to the available data) and Abstracts Views on Vision4Press platform.
Data correspond to usage on the plateform after 2015. The current usage metrics is available 48-96 hours after online publication and is updated daily on week days.
Initial download of the metrics may take a while.