Fig. 7
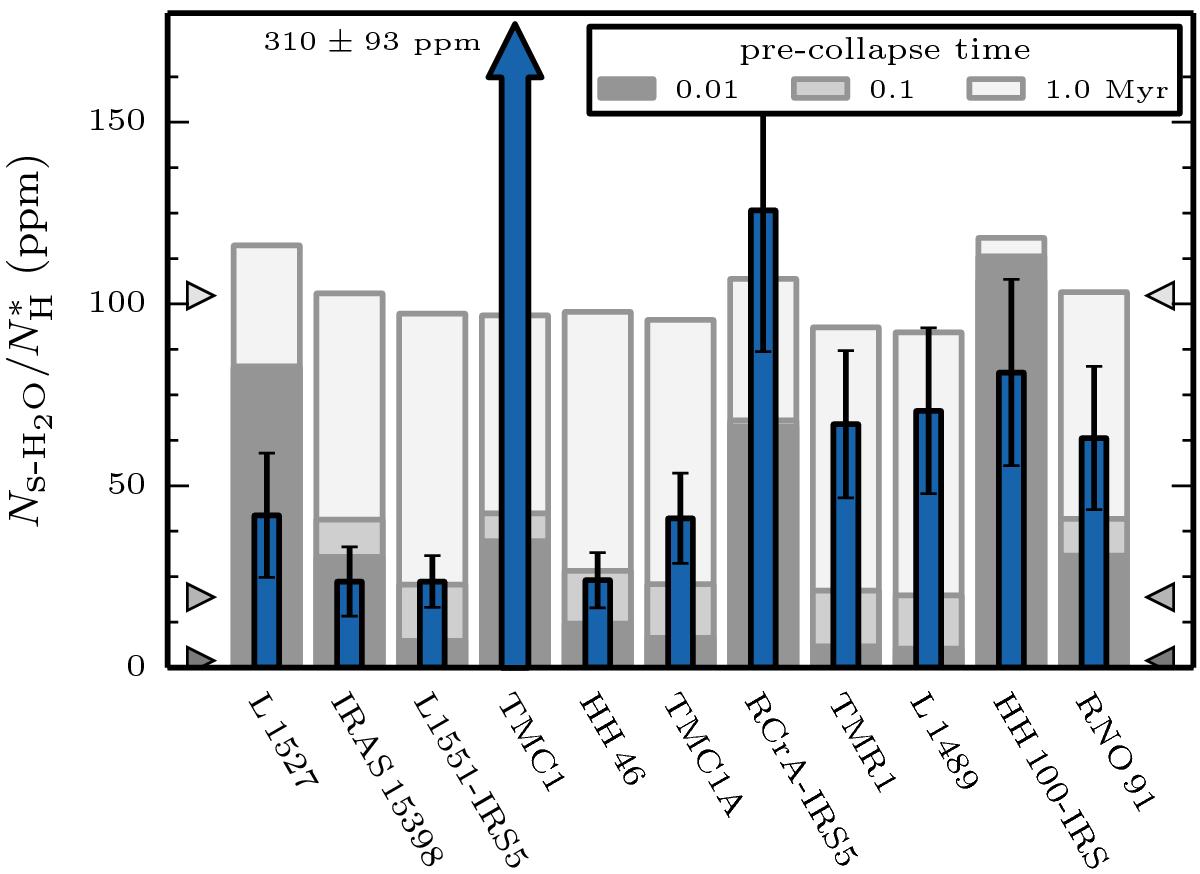
Observed (blue) and modelled (grey) column-density-averaged water ice abundance
ratios ![]() in the water freeze-out zone. The
displayed models show the water ice abundances for pre-collapse times of 0.01, 0.1,
and 1.0 Myr, followed by
a post-collapse time of 1.0
Myr. Another run with tpost = 0.1 Myr (not displayed
here) reveals a marginal dependence of the abundances on the post-collapse time,
with the results being the same as for tpost = 1.0 Myr within
≲ 10−15 ppm.
in the water freeze-out zone. The
displayed models show the water ice abundances for pre-collapse times of 0.01, 0.1,
and 1.0 Myr, followed by
a post-collapse time of 1.0
Myr. Another run with tpost = 0.1 Myr (not displayed
here) reveals a marginal dependence of the abundances on the post-collapse time,
with the results being the same as for tpost = 1.0 Myr within
≲ 10−15 ppm.
Current usage metrics show cumulative count of Article Views (full-text article views including HTML views, PDF and ePub downloads, according to the available data) and Abstracts Views on Vision4Press platform.
Data correspond to usage on the plateform after 2015. The current usage metrics is available 48-96 hours after online publication and is updated daily on week days.
Initial download of the metrics may take a while.