Fig. 5
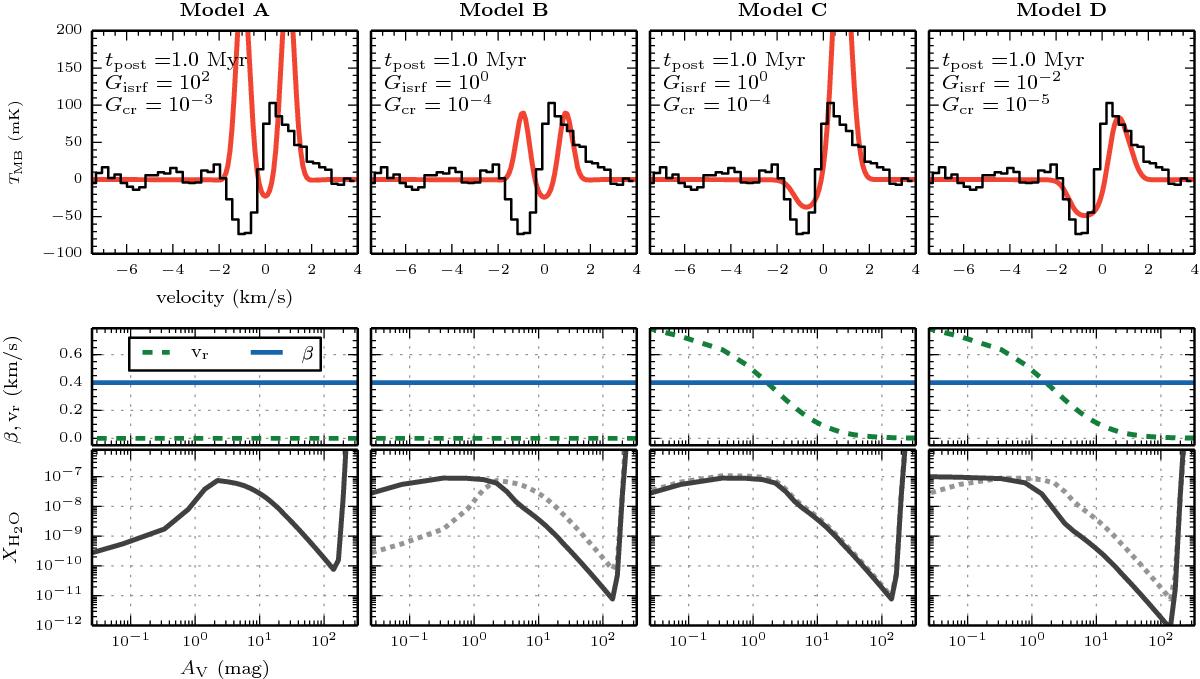
Synthetic H2O(110−101) observations for L1551-IRS5, assuming different parameters for the FUV fluxes (Gisrf and Gcr), and velocity profiles (radial velocity vr and the turbulent broadening Doppler-β) in a sequence from Model A to D. The top row shows the synthetic spectra (red) alongside the observations (black), which have been shifted by the systemic velocity. The middle row depicts the assumed velocity profile, and the bottom row shows the water abundance profile. For comparison, the abundance profile of the preceding model is shown as dashed line.
Current usage metrics show cumulative count of Article Views (full-text article views including HTML views, PDF and ePub downloads, according to the available data) and Abstracts Views on Vision4Press platform.
Data correspond to usage on the plateform after 2015. The current usage metrics is available 48-96 hours after online publication and is updated daily on week days.
Initial download of the metrics may take a while.