Fig. 3
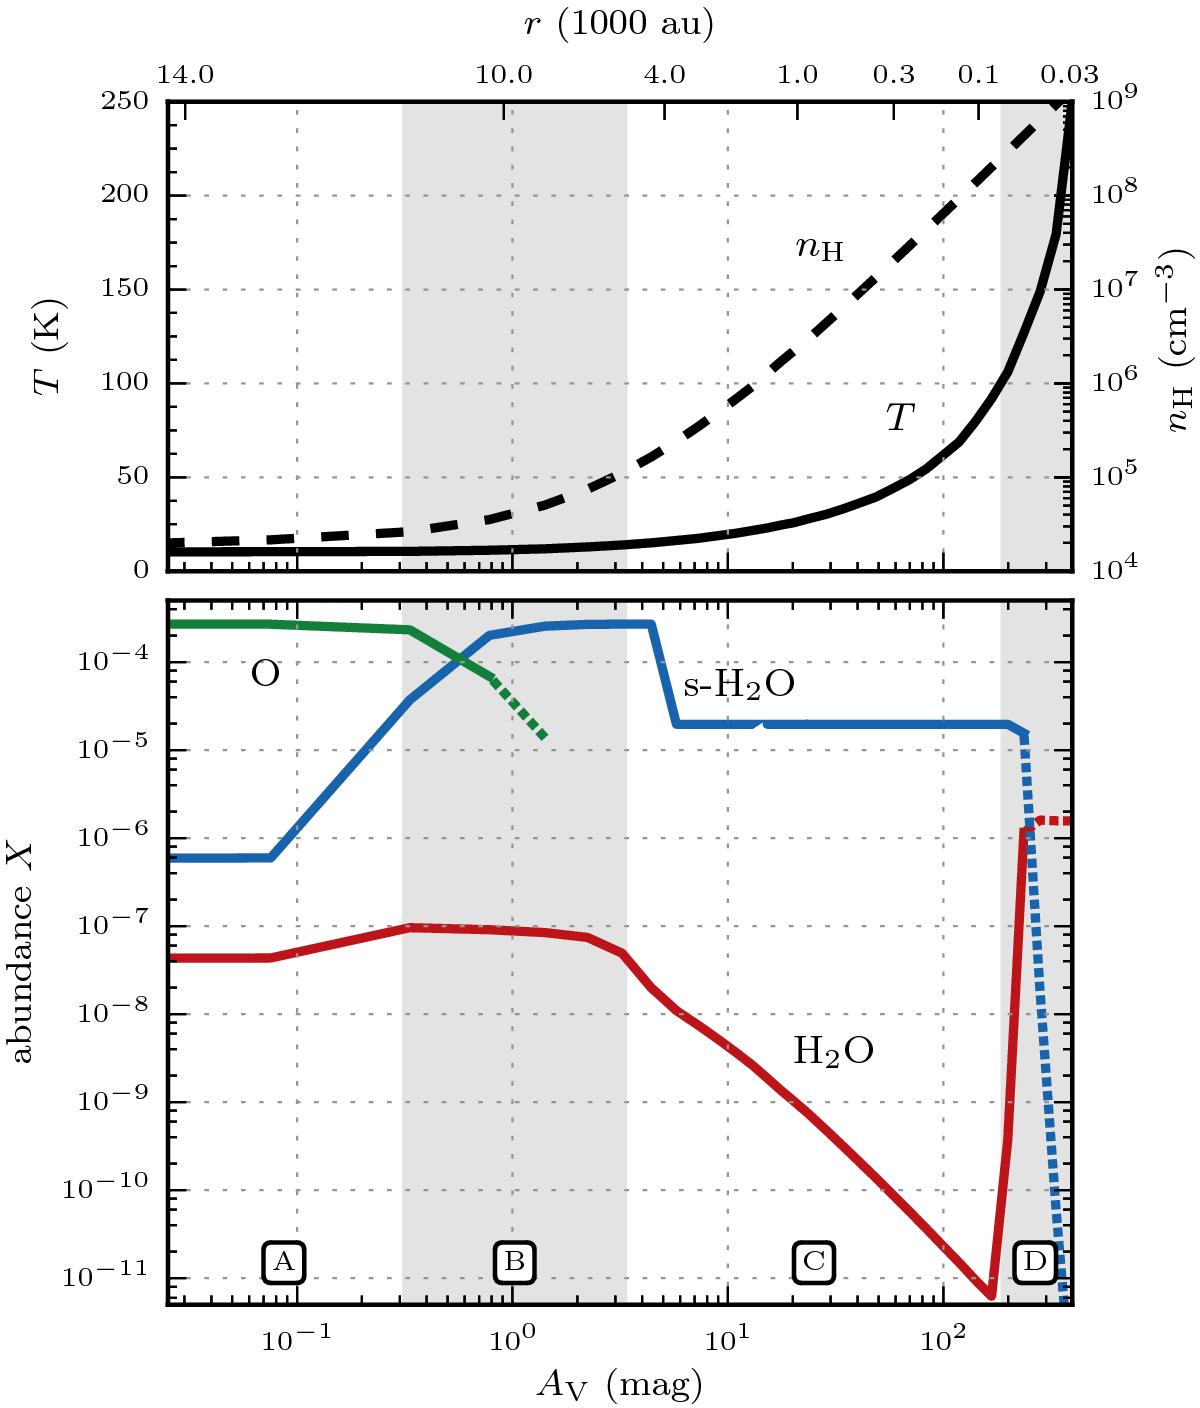
The top panel shows the hydrogen volume density (dashed) and the gas/dust temperature (solid) profiles as a function of radial extinction AV and radius r for L1551-IRS5 for default values of the FUV fluxes (Gisrf = 1, Gcr = 10-4). The bottom panel depicts the abundance structure of water ice (s - H2O) and water vapour (H2O) with respect to total hydrogen as modelled with SWaN after t = 1 Myr. The benchmarking of SWaN showed that the abundance of atomic oxygen is not reliably determined deeper into the cloud, which is why X(O) is not shown beyond AV ≳ 2 mag. The different regions (A-D) are discussed in more detail in the text. It should be noted that in this and subsequent figures, the edge of the envelope is on the left and the protostar on the right-hand side.
Current usage metrics show cumulative count of Article Views (full-text article views including HTML views, PDF and ePub downloads, according to the available data) and Abstracts Views on Vision4Press platform.
Data correspond to usage on the plateform after 2015. The current usage metrics is available 48-96 hours after online publication and is updated daily on week days.
Initial download of the metrics may take a while.