Fig. 5
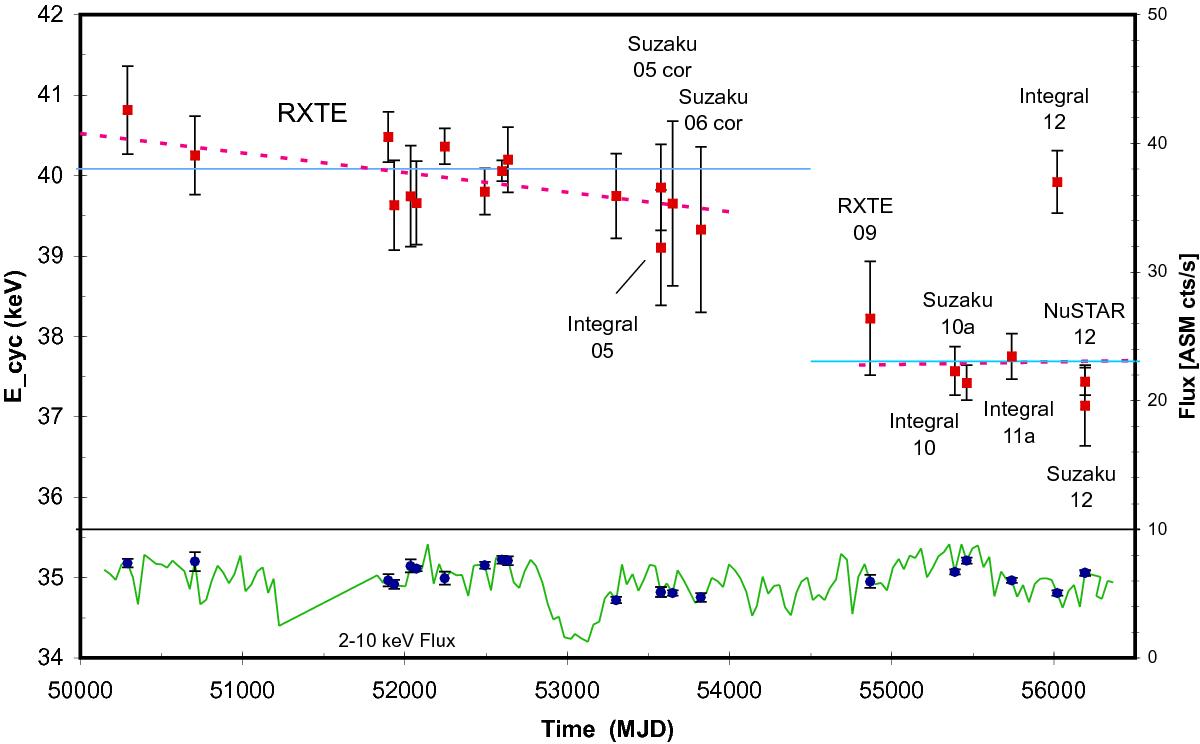
Upper panel, left scale: Her X-1 pulse phase averaged cyclotron line energies Ecyc normalized to a reference ASM count rate of 6.8 cts/s using a flux dependence of 0.54 keV/ASM-cts/s. A break in mean Ecyc after MJD 54 000 (>2006) is apparent. Lower panel, right scale: 2–10 keV X-ray flux (of 35 d maximum) from monitoring by RXTE/ASM (from Swift/BAT after MJD 56 000). Blue data points with uncertainties are those fluxes which are used to correlate with Ecyc, the green curve connects measurements of each 35 d cycle.
Current usage metrics show cumulative count of Article Views (full-text article views including HTML views, PDF and ePub downloads, according to the available data) and Abstracts Views on Vision4Press platform.
Data correspond to usage on the plateform after 2015. The current usage metrics is available 48-96 hours after online publication and is updated daily on week days.
Initial download of the metrics may take a while.