Fig. 3
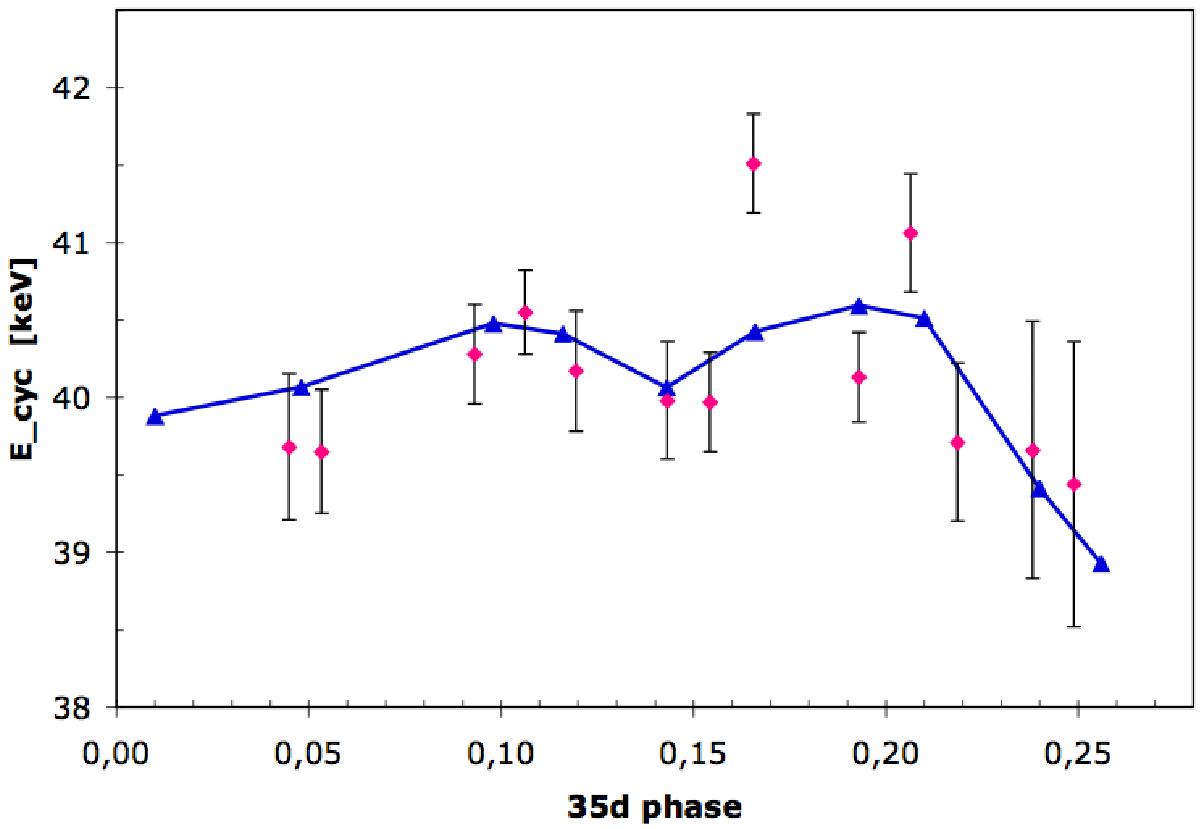
Centroid pulse phase averaged cyclotron line energies at different 35 d phases of Main-On cycle 323. The data points with uncertainties are direct measurements for ten small integration intervals. The blue triangles connected by the solid blue line are values which are calculated by folding observed pulse profiles in the 30–45 keV range with template (Ecyc vs. pulse phase)-profiles for the same 35 d phases (see text for a detailed description).
Current usage metrics show cumulative count of Article Views (full-text article views including HTML views, PDF and ePub downloads, according to the available data) and Abstracts Views on Vision4Press platform.
Data correspond to usage on the plateform after 2015. The current usage metrics is available 48-96 hours after online publication and is updated daily on week days.
Initial download of the metrics may take a while.