Fig. 2
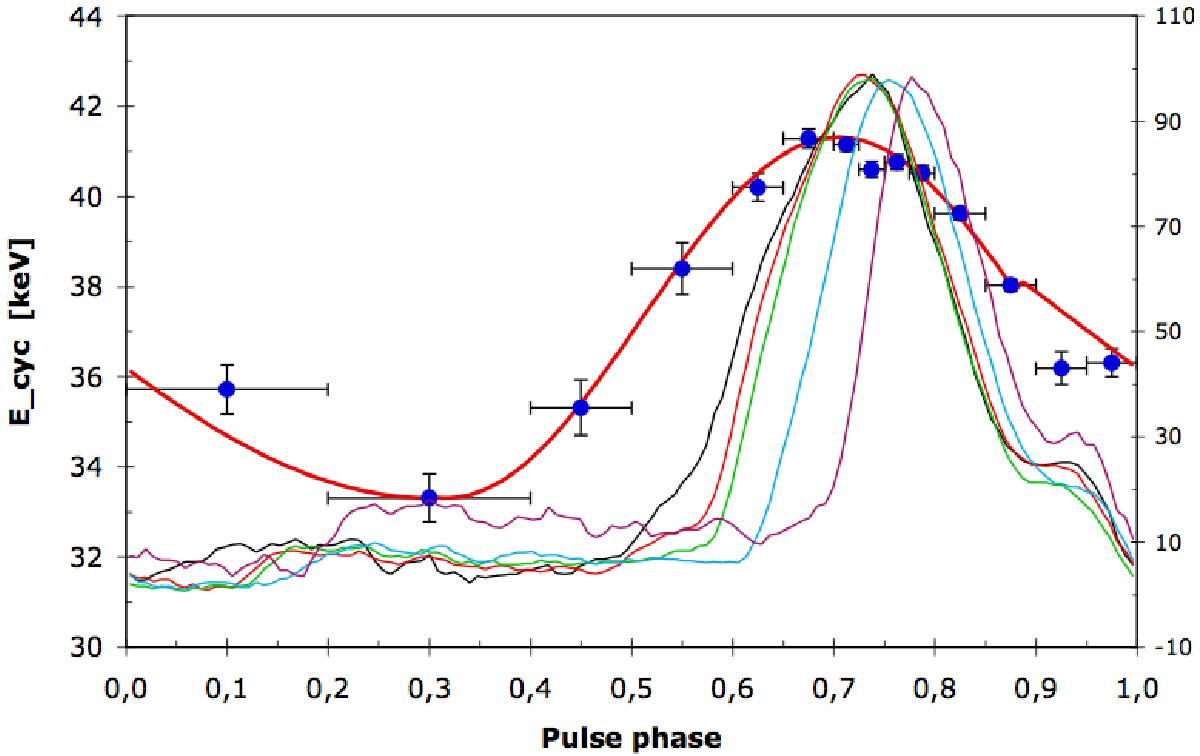
Mean dependence of cyclotron line energy on pulse phase for the Main-On of 35 d cycle 323, as observed by RXTE/PCA in 2002 November. The solid red line represents a best fit function (a combination of two cosine components). Normalized pulse profiles of the 30–45 keV range are shown for five different 35 d phases: 0.048 (black), 0.116 (red), 0.166 (green), 0.21 (blue) and 0.24 (purple). The main pulse is progressively moving to the right. The right hand scale is normalized flux (0–100) for the pulse profiles.
Current usage metrics show cumulative count of Article Views (full-text article views including HTML views, PDF and ePub downloads, according to the available data) and Abstracts Views on Vision4Press platform.
Data correspond to usage on the plateform after 2015. The current usage metrics is available 48-96 hours after online publication and is updated daily on week days.
Initial download of the metrics may take a while.