Fig. 1
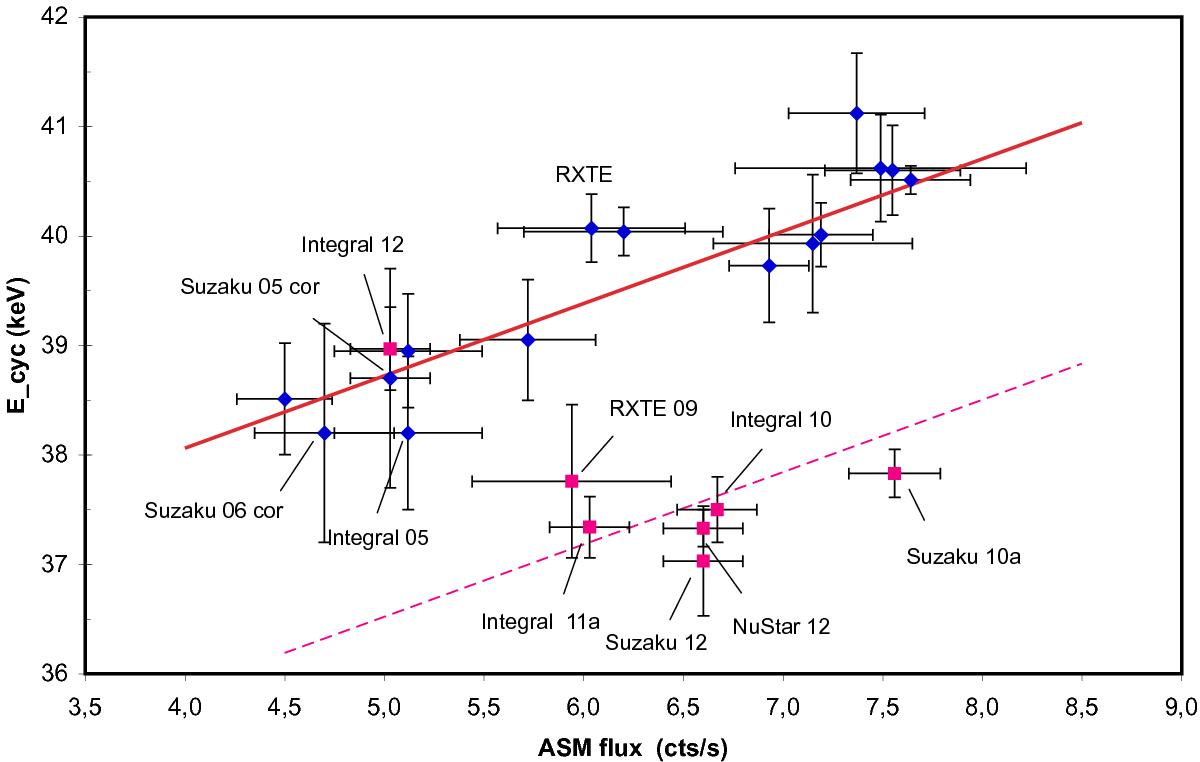
Positive correlation between the cyclotron line energy and the maximum X-ray flux of the corresponding 35 day cycle as measured by RXTE/ASM (see Fig. 2 of Staubert et al. 2007) with eight added points: INTEGRAL 2005 (Klochkov et al. 2008a), Suzaku of 2005 and 2006 (Enoto et al. 2008), RXTE 2009, INTEGRAL 2010, Suzaku 2010 and 2012, and NuSTAR 2012. The Suzaku points of 2005/2006 have been corrected upward by 2.8 keV, to account for the difference arising because the Lorentzian profile was used in the analysis by Enoto et al. (2008), while for all others the Gaussian profile was used. The blue rhombs are values observed until 2006, the red dots are from after 2006. The solid red line is a linear fit to data until 2006 with the original slope of 0.66 keV/(ASM cts/s), as found by Staubert et al. (2007). The dotted red line is the best fit to the data after 2006 with the slope fixed to the same value.
Current usage metrics show cumulative count of Article Views (full-text article views including HTML views, PDF and ePub downloads, according to the available data) and Abstracts Views on Vision4Press platform.
Data correspond to usage on the plateform after 2015. The current usage metrics is available 48-96 hours after online publication and is updated daily on week days.
Initial download of the metrics may take a while.