Fig. 8
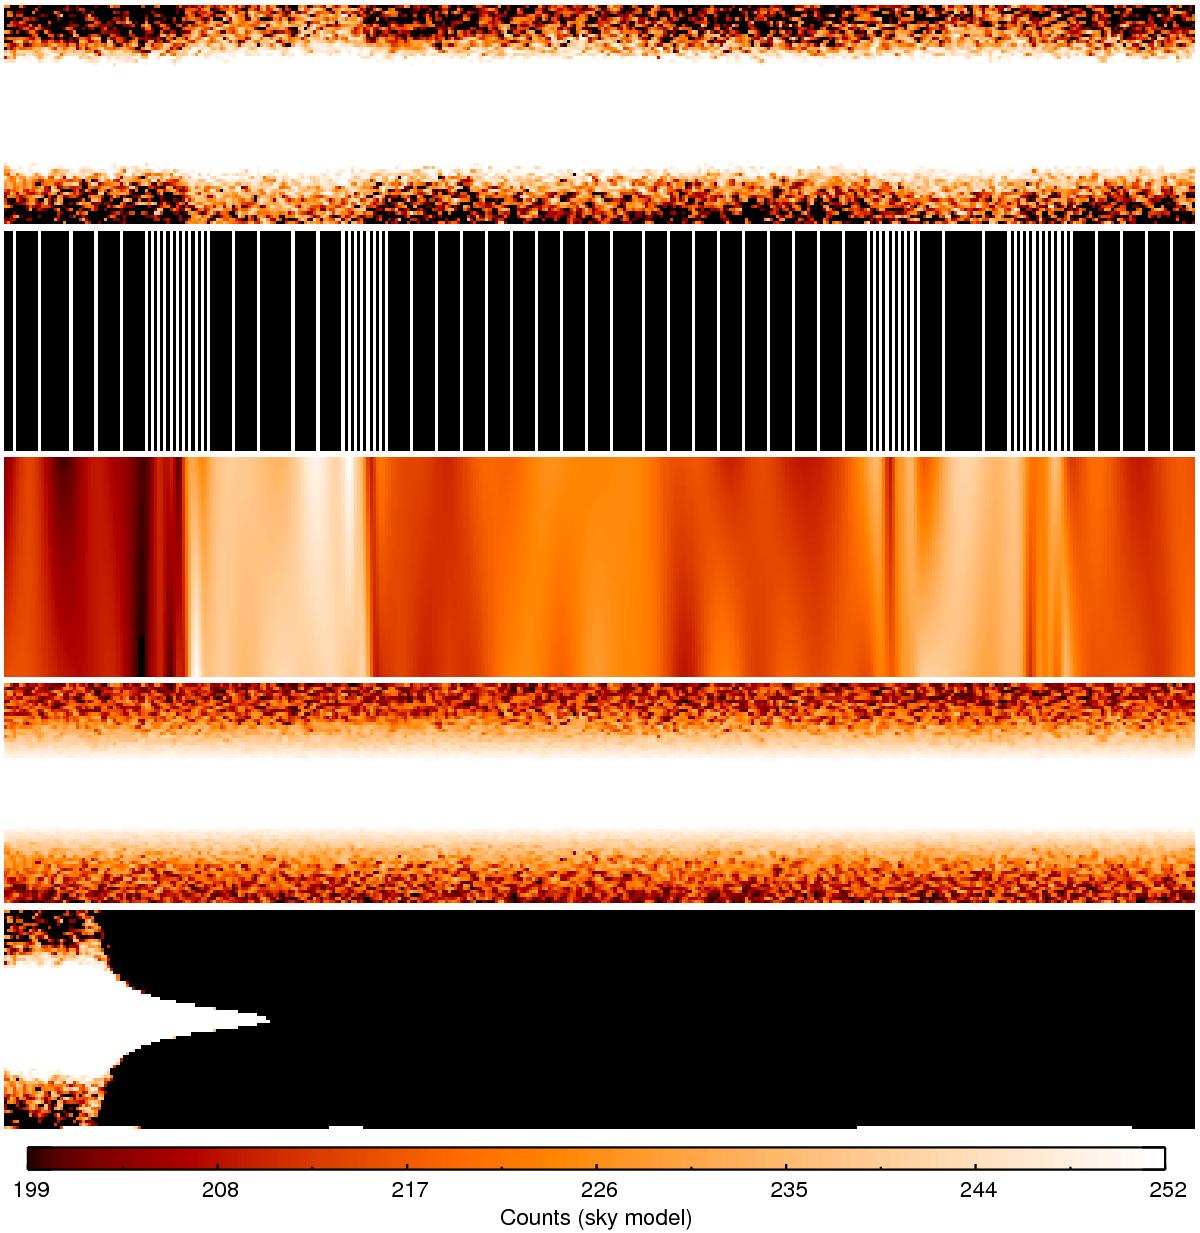
Sky subtraction sequence for GD71. The top panel shows a rectified spectrum of GD71 with an additional sky component. The break point distribution that forms the basis for the fits to the sky spectrum is shown in the second panel, while the corresponding sky model, based on two separate spline fits at either side of the stellar PSF and an additional interpolation along the cross-dispersed direction, is shown in the third panel. The final sky-subtracted spectrum of GD71 is presented in the fourth panel. For comparison, the fifth panel shows the corresponding result obtained with the X-shooter pipeline, which failed to produce an acceptable solution for the shown wavelength range (7742 Å to 7770 Å) and other parts of the spectrum. The color scaling of the sky model is illustrated in the bar at the bottom.
Current usage metrics show cumulative count of Article Views (full-text article views including HTML views, PDF and ePub downloads, according to the available data) and Abstracts Views on Vision4Press platform.
Data correspond to usage on the plateform after 2015. The current usage metrics is available 48-96 hours after online publication and is updated daily on week days.
Initial download of the metrics may take a while.