Fig. 7
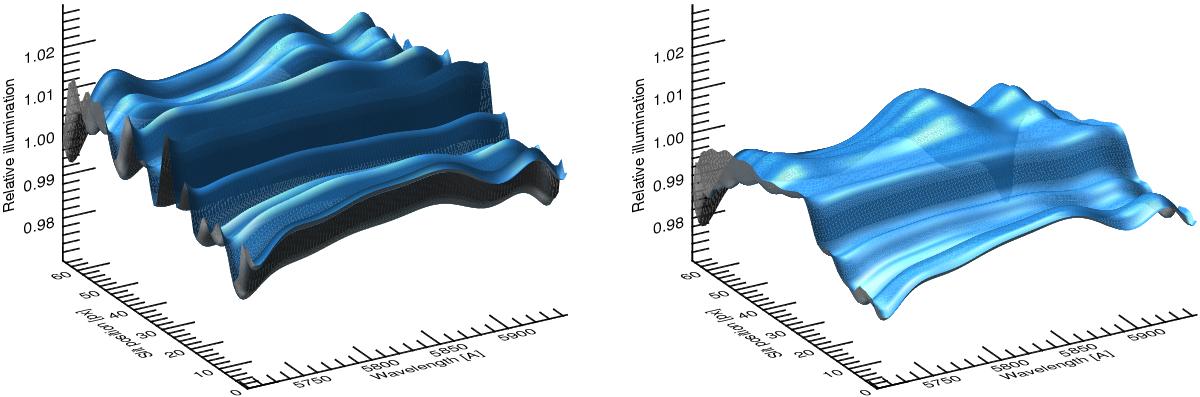
Two-dimensional illumination surfaces of echelle order three of the VIS arm for a 0.4″ slit (left) and a 5.0″ slit (right). The x-axis corresponds to the spectral dispersion direction, the y-axis to the cross-dispersed direction. The relative illumination is plotted on the z-axis. The maximum impact of the inhomogeneities is on the order of ±2.0%. The blue highlights and shadows were introduced to facilitate the visualization of the three-dimensional structure.
Current usage metrics show cumulative count of Article Views (full-text article views including HTML views, PDF and ePub downloads, according to the available data) and Abstracts Views on Vision4Press platform.
Data correspond to usage on the plateform after 2015. The current usage metrics is available 48-96 hours after online publication and is updated daily on week days.
Initial download of the metrics may take a while.