Fig. 6
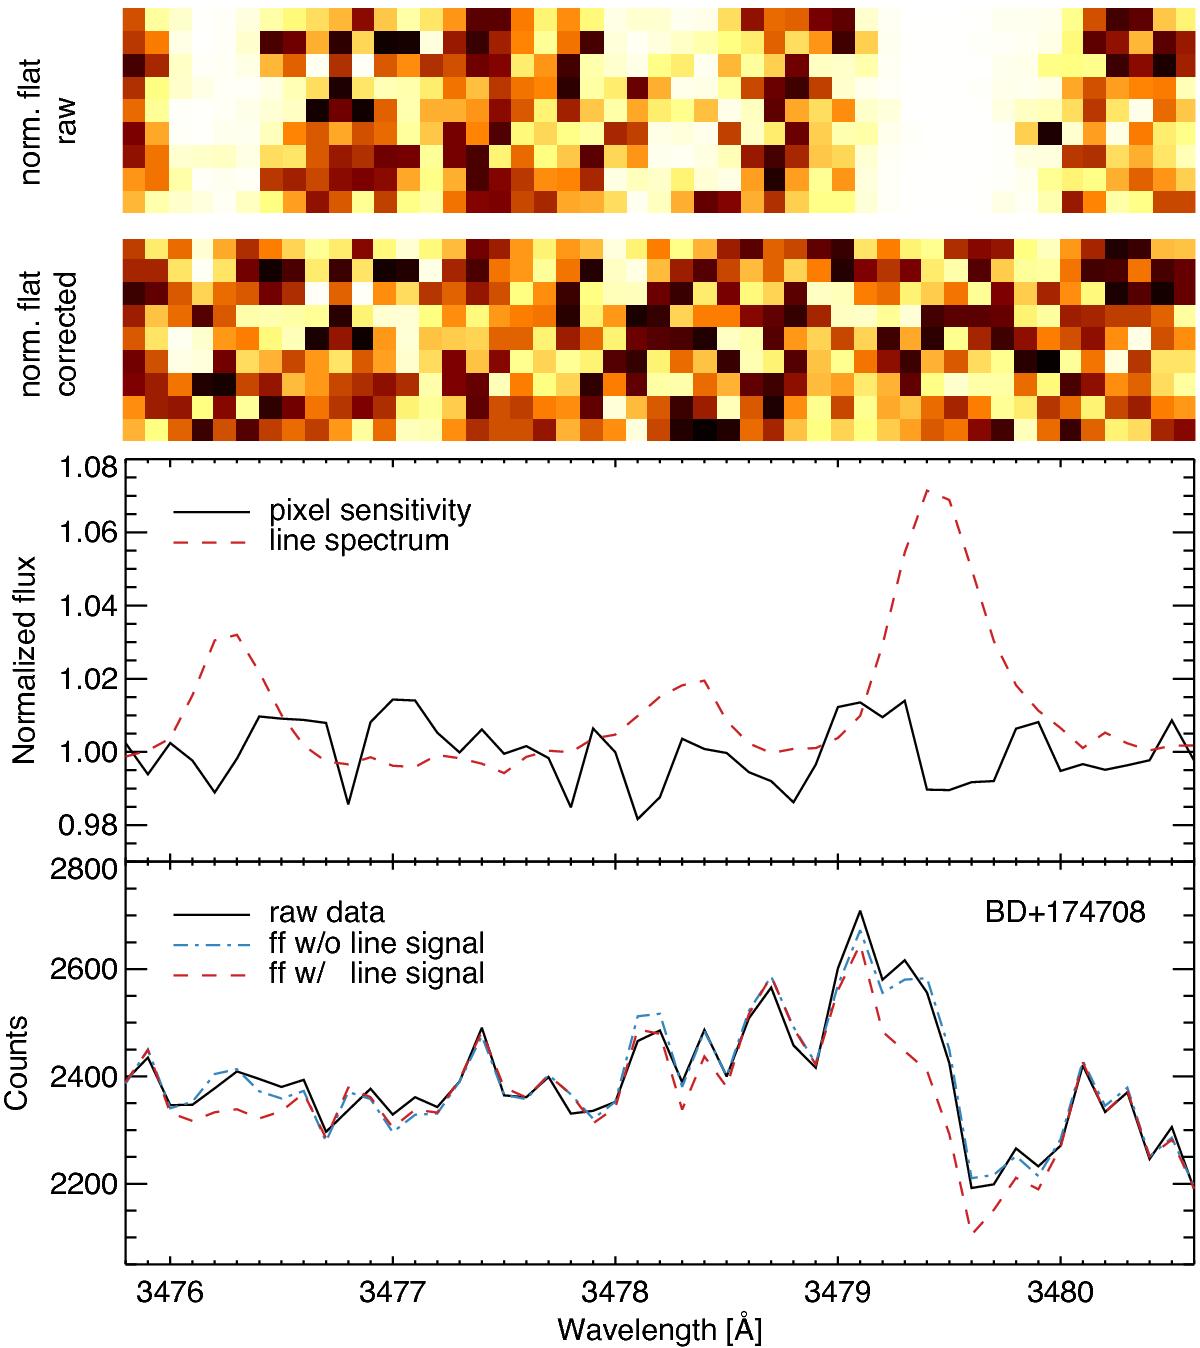
UVB flat field performance analysis. The top panel shows a zoomed-in section of the continuum-normalized SED of the D2 flat field lamp (echelle order four). The line emission is removed with an additional median along the cross-dispersed direction (second panel). In the third panel, we show the pixel-to-pixel quantum efficiency variations (solid black curve) at the central slit position and the corresponding line emission spectrum (dashed red curve). The bottom panel shows the SED of BD+174708 without flat fielding (solid black curve), flat fielded with the continuum-normalized D2 lamp SED (dot-dashed red curve), and flat fielded with its emission-line-free counterpart (dashed blue curve). The wavelength scales of the four panels are aligned so that the positions of the emission lines are the same for images and plots.
Current usage metrics show cumulative count of Article Views (full-text article views including HTML views, PDF and ePub downloads, according to the available data) and Abstracts Views on Vision4Press platform.
Data correspond to usage on the plateform after 2015. The current usage metrics is available 48-96 hours after online publication and is updated daily on week days.
Initial download of the metrics may take a while.