Fig. 5
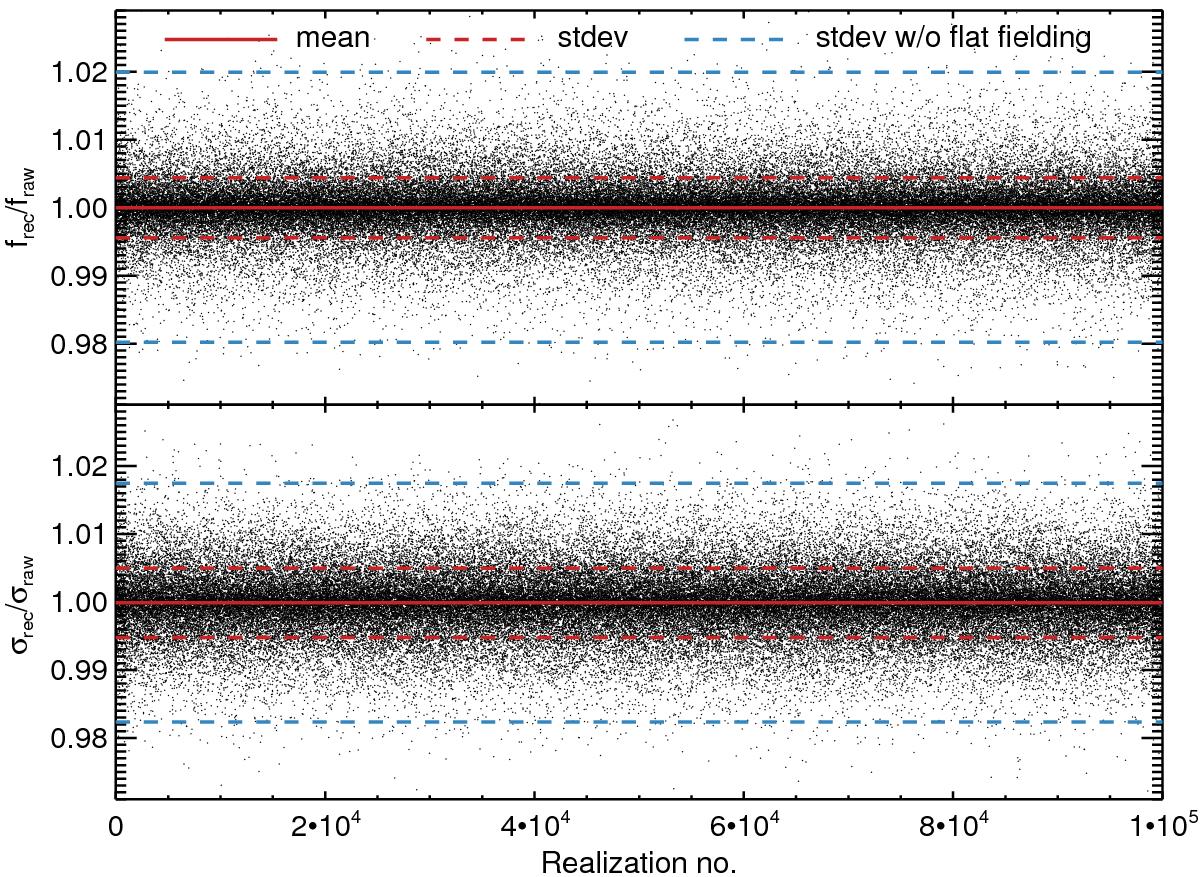
Ratios of 105 realizations of Eqs. (6) and (7). The interpolation is performed with a Lanczos kernel for random locations inside the inner ±3σ of a Gaussian emission line with a FWHM of 3.5 pixels (assuming Poisson noise). The pixel responses are modeled with a normal distribution with μ = 1 and σ = 0.02. In both panels (top: flux ratios, bottom: error ratios) the solid red line shows the ensemble mean, the dashed red line its standard deviation, and the blue dashed line the standard deviation when the data are rectified but flat fielding is not applied afterwards.
Current usage metrics show cumulative count of Article Views (full-text article views including HTML views, PDF and ePub downloads, according to the available data) and Abstracts Views on Vision4Press platform.
Data correspond to usage on the plateform after 2015. The current usage metrics is available 48-96 hours after online publication and is updated daily on week days.
Initial download of the metrics may take a while.