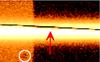
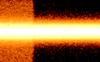
Fig. 4
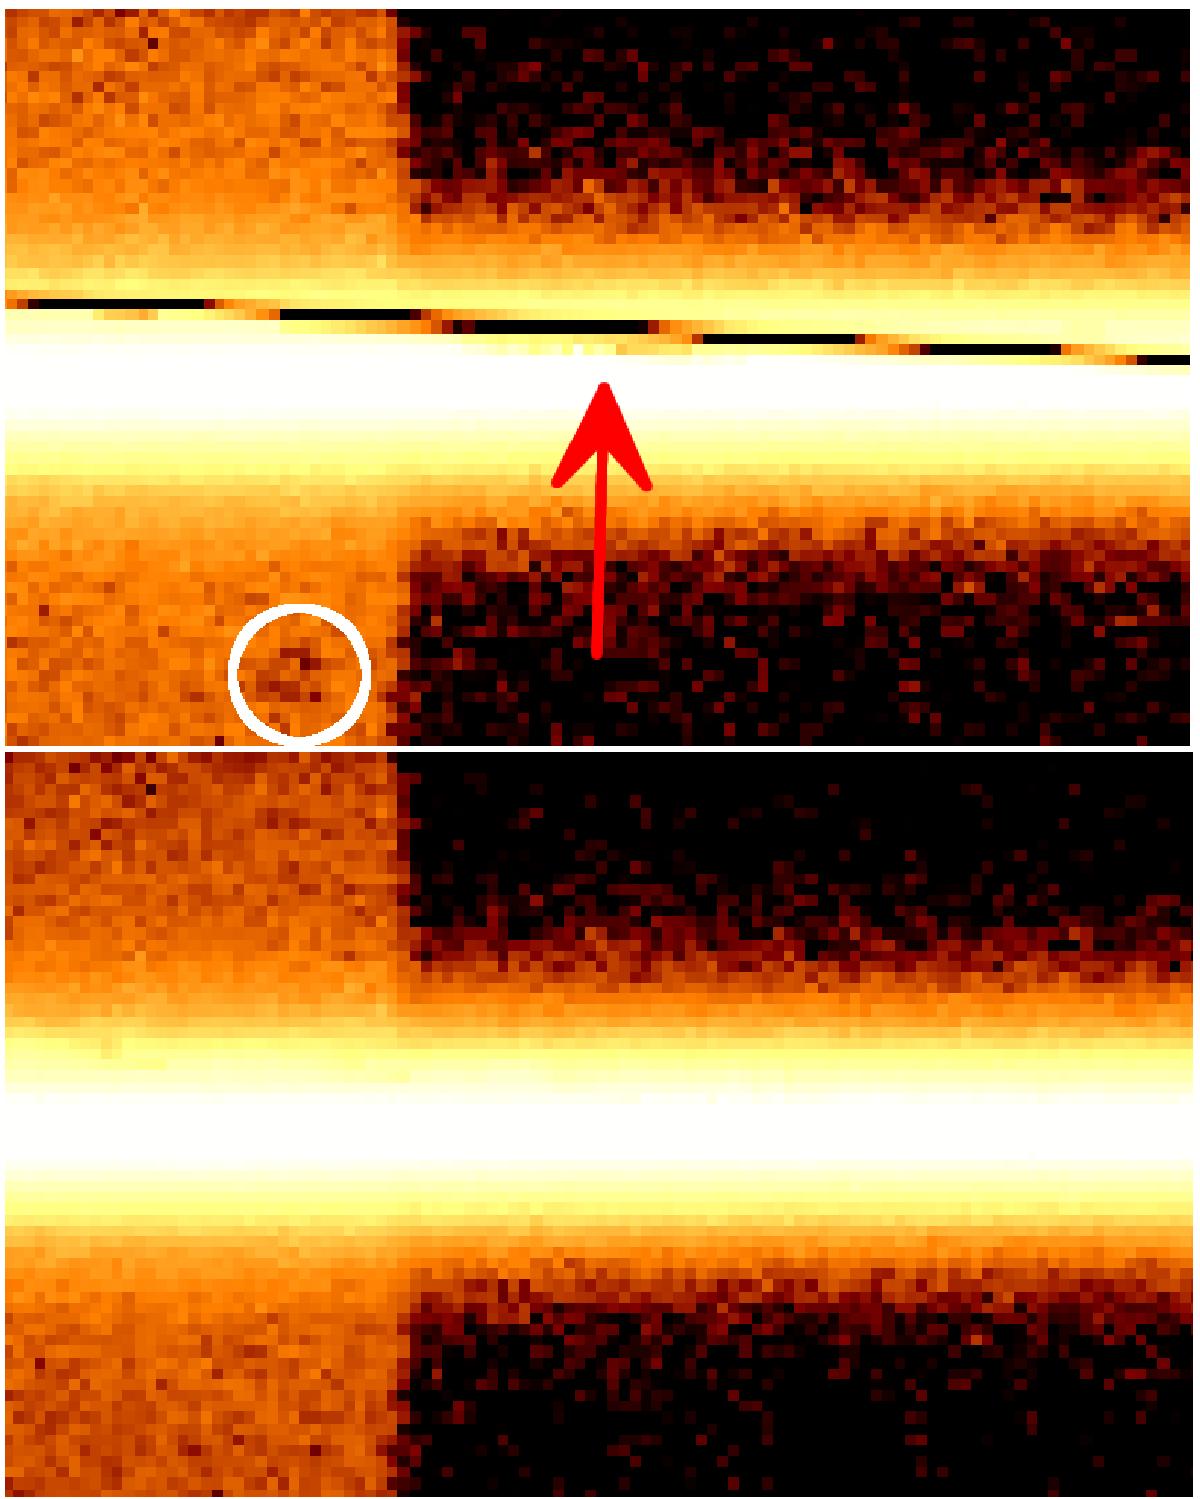
Zoomed-in section of the rectified echelle order five of GD71 (VIS) before (top) and after (bottom) application of the bad pixel interpolation. The artifacts of the bad columns 853 and 854 in the raw frame are visible as a dark stripe intersecting the illuminated echelle order. The area of reduced counts below the diagonal bad pixel stripe (indicated by the red arrow) is a consequence of the CRH rejection explained in Sect. 4.2. The cold spot at the lower left of the shown CCD section (marked by the white circle) is also reasonably corrected by our algorithm. The spectral dispersion direction runs horizontally along the x-axis. The plotted wavelength range is roughly 10 Å and the size along the cross-dispersed direction is ~4″. A vertical slice through these spectra is shown in Fig. 3.
Current usage metrics show cumulative count of Article Views (full-text article views including HTML views, PDF and ePub downloads, according to the available data) and Abstracts Views on Vision4Press platform.
Data correspond to usage on the plateform after 2015. The current usage metrics is available 48-96 hours after online publication and is updated daily on week days.
Initial download of the metrics may take a while.