Fig. 3
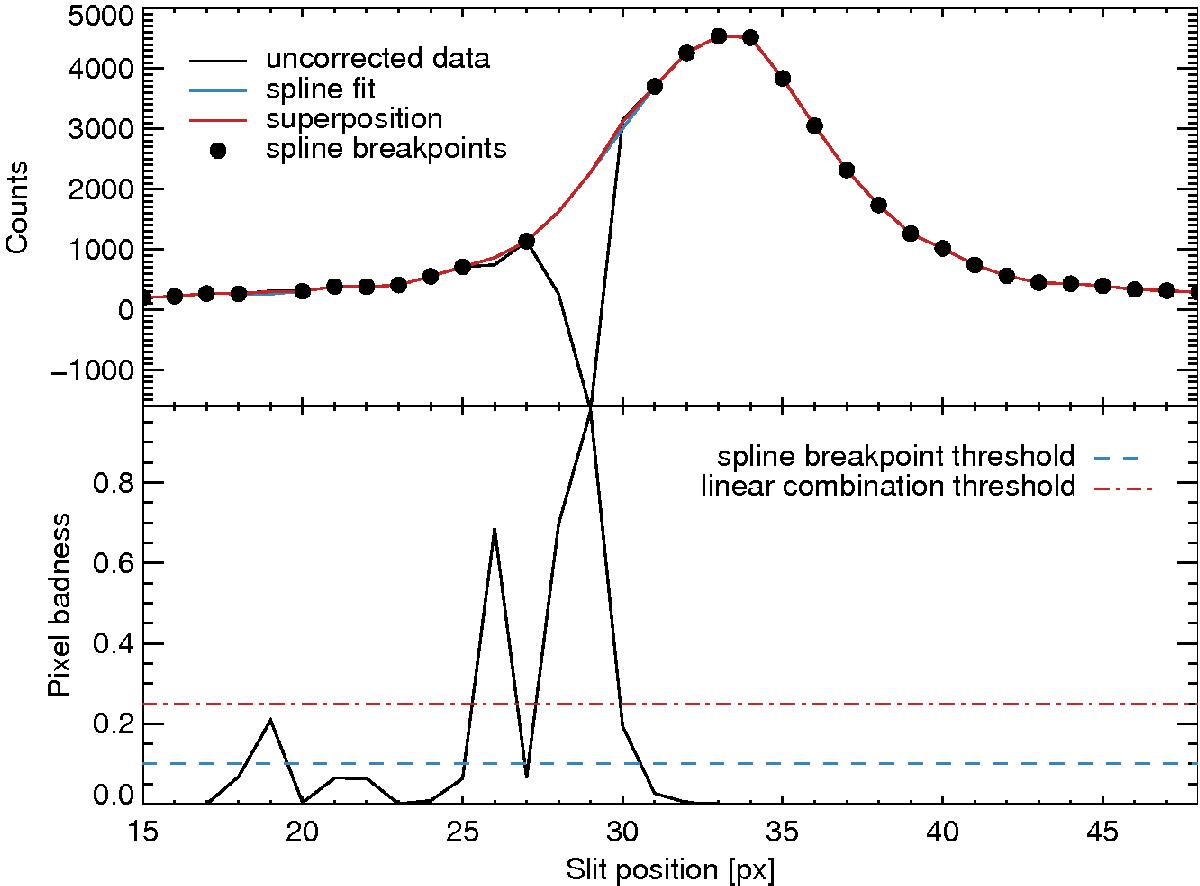
Cut through rectified echelle order five of GD71 (VIS), which is intersected by two adjacent bad columns on the raw frame. The top panel shows the uncorrected PSF (black curve), the weighted spline fit (blue curve) and the weighted linear combination of both (red curve). The solid circles show the grid locations that are used as break points for the spline fit. The weighting factors are based on the pixel badness as depicted in the bottom panel. The thresholds for the spline break points (blue dashed line) and the weighted linear combination (red dash-dotted line) are overplotted.
Current usage metrics show cumulative count of Article Views (full-text article views including HTML views, PDF and ePub downloads, according to the available data) and Abstracts Views on Vision4Press platform.
Data correspond to usage on the plateform after 2015. The current usage metrics is available 48-96 hours after online publication and is updated daily on week days.
Initial download of the metrics may take a while.