Fig. 18
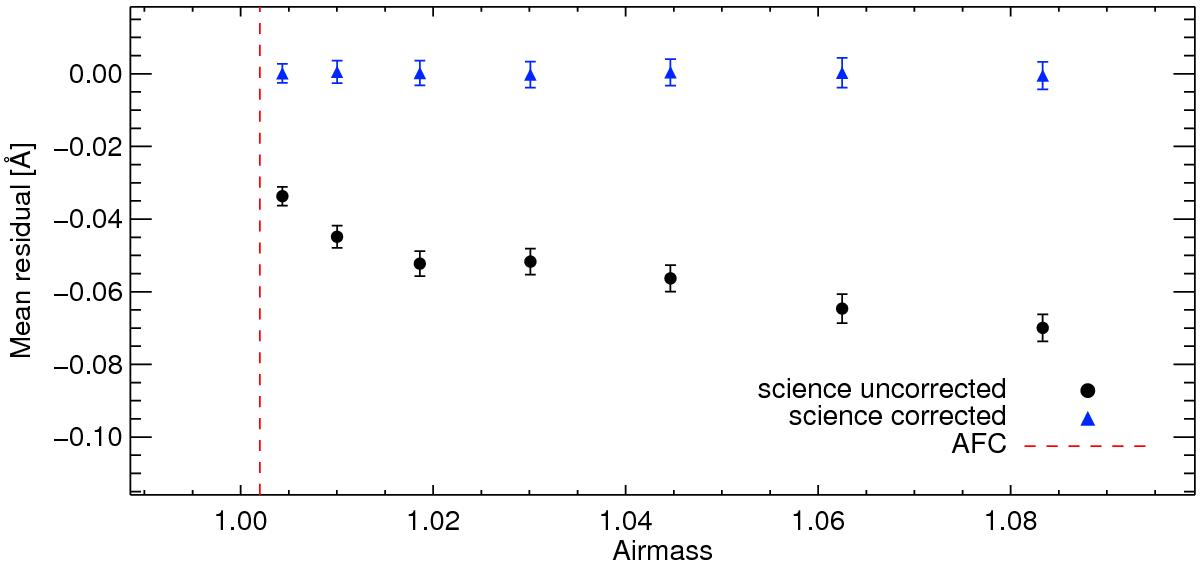
Mean wavelength residuals as a function of airmass for six observations of NGC 7099 and one additional sky frame. The black data points reflect the uncorrected weighted mean of all sky line residuals as explained in the text and shown in Fig. 17. Correcting the wavelength solution of each observation by means of Eq. (11) removes the bias (blue data points). The error bars illustrate the uncertainties of the weighted mean and represent the significance of the observed trend with airmass. The airmass at which the AFC measurement was performed is indicated with the dashed red line.
Current usage metrics show cumulative count of Article Views (full-text article views including HTML views, PDF and ePub downloads, according to the available data) and Abstracts Views on Vision4Press platform.
Data correspond to usage on the plateform after 2015. The current usage metrics is available 48-96 hours after online publication and is updated daily on week days.
Initial download of the metrics may take a while.