Fig. 17
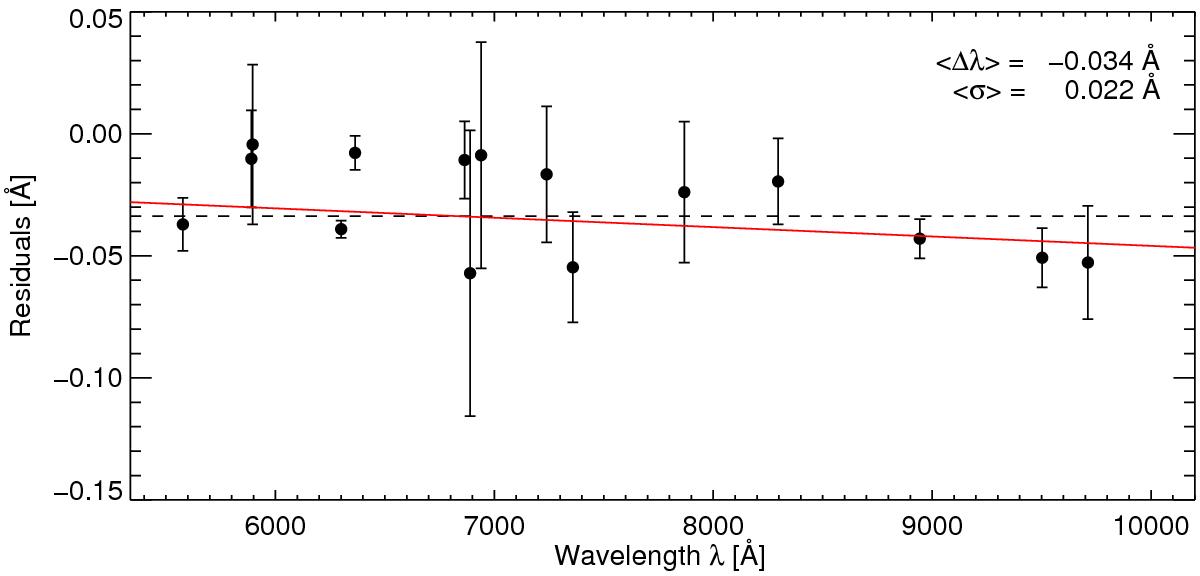
Wavelength residuals as a function of wavelength for 15 non-blended telluric lines. The individual data points and their uncertainties are derived as illustrated in Fig. 16. The global weighted mean residual is − 0.034 Å and is overplotted with a dashed black line. The error of the weighted mean is 0.022 Å. The best-fit straight line is overplotted in red.
Current usage metrics show cumulative count of Article Views (full-text article views including HTML views, PDF and ePub downloads, according to the available data) and Abstracts Views on Vision4Press platform.
Data correspond to usage on the plateform after 2015. The current usage metrics is available 48-96 hours after online publication and is updated daily on week days.
Initial download of the metrics may take a while.