Fig. 12
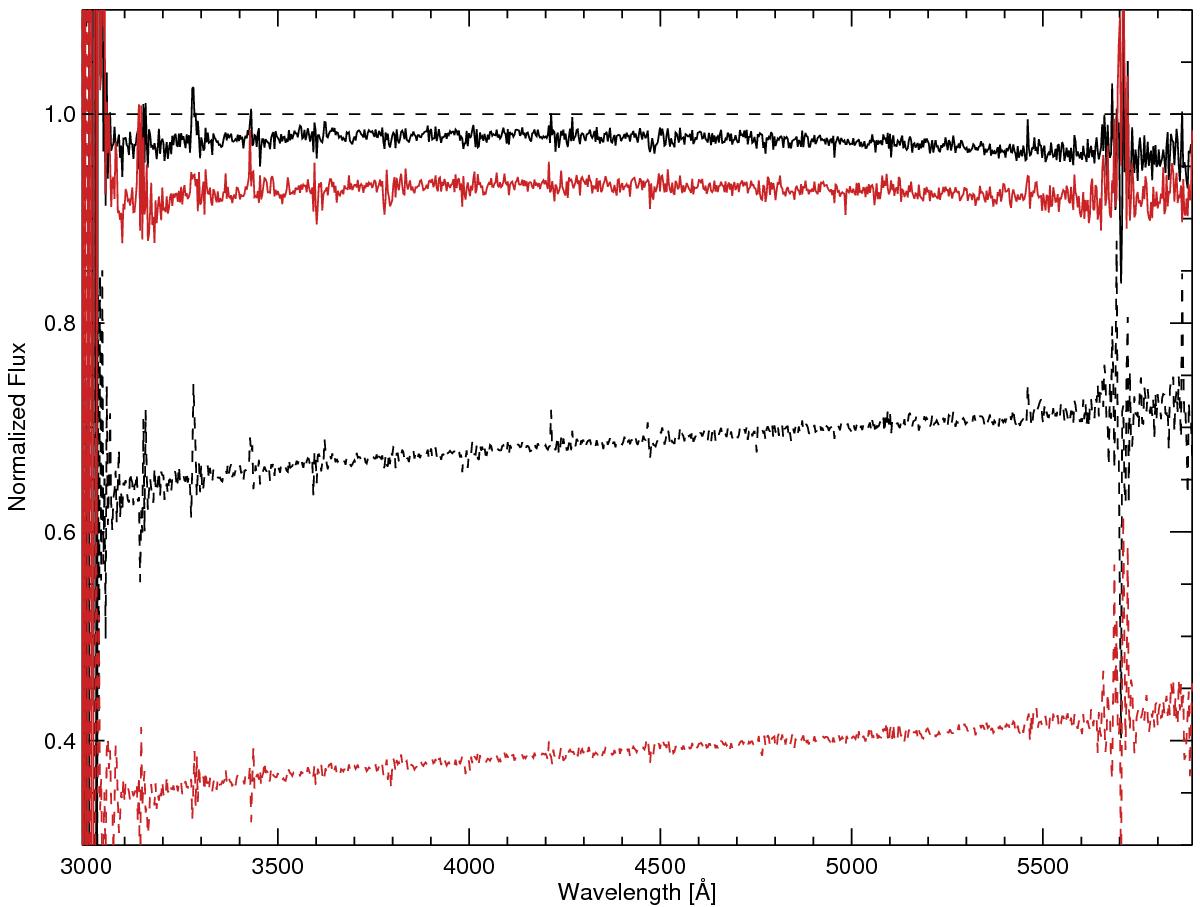
Normalized fluxes of GD71 in the UVB arm obtained with two different slit widths and two different extraction methods. The solid black (red) curve shows the optimally extracted and flux loss corrected data of the 1.0″ (0.5″) slit exposure, whereas the corresponding dashed curves show the conventional approach of collapsing the entire slit. All exposures have been normalized to the detected counts of a 5.0″ slit exposure, for which no significant flux losses have been measured. The data shown here are the merged result of all UVB orders. We note that the curves have been smoothed so that systematic trends can emerge.
Current usage metrics show cumulative count of Article Views (full-text article views including HTML views, PDF and ePub downloads, according to the available data) and Abstracts Views on Vision4Press platform.
Data correspond to usage on the plateform after 2015. The current usage metrics is available 48-96 hours after online publication and is updated daily on week days.
Initial download of the metrics may take a while.