Fig. 10
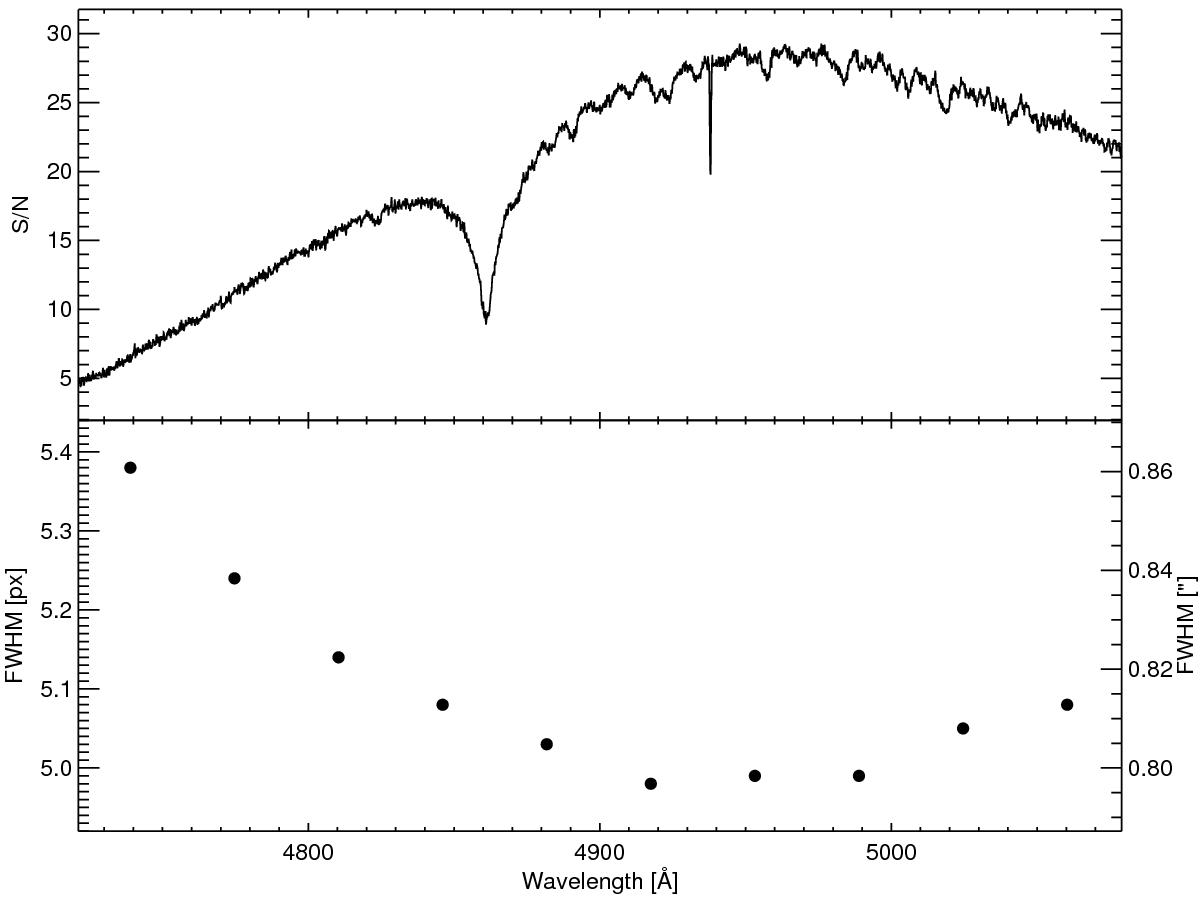
Optimally-extracted S/N spectrum (top panel) and measured FWHM (bottom panel) in echelle order 10 (UVB arm) for HD 38237. The downward S/N spike at 4938 Å arises from a cold spot on the CCD and demonstrates the quality of our optimal extraction procedure. The FWHM shows variations on a five percent level with a minimum close to the blaze wavelength.
Current usage metrics show cumulative count of Article Views (full-text article views including HTML views, PDF and ePub downloads, according to the available data) and Abstracts Views on Vision4Press platform.
Data correspond to usage on the plateform after 2015. The current usage metrics is available 48-96 hours after online publication and is updated daily on week days.
Initial download of the metrics may take a while.