Fig. 1
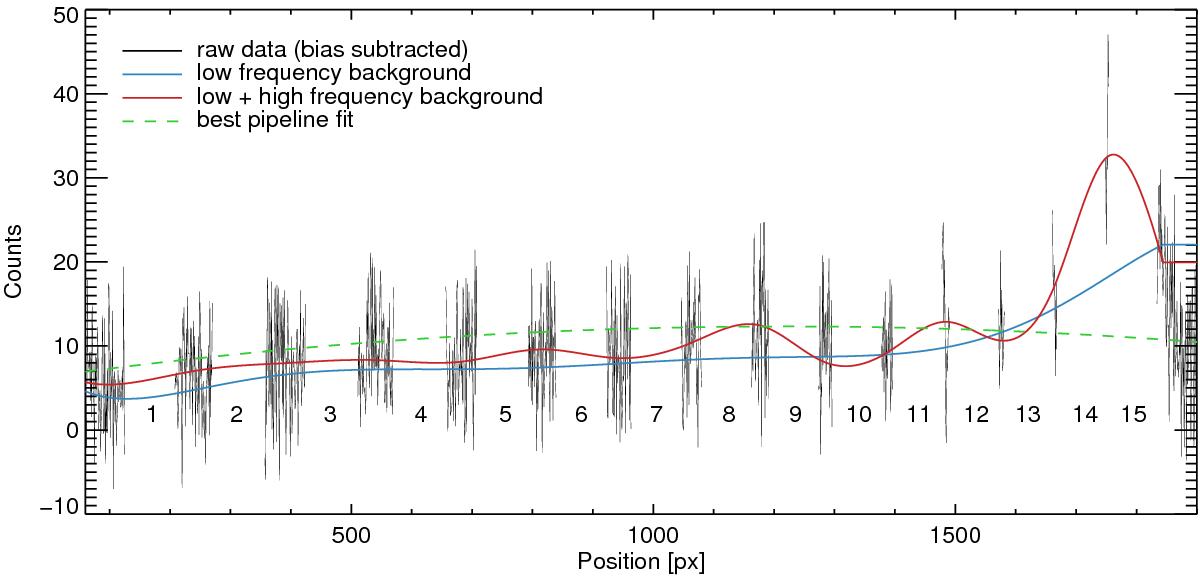
Horizontal cut through a bias subtracted VIS raw frame of GD71. The blue curve shows the low order Chebyshev fit and the red curve the superposition of the Chebyshev fit and an additional spline fit. The best background fit obtained with the ESO pipeline is overplotted as a dashed green line. The gaps in the data (black curve) indicate the positions of the echelle orders. The respective order numbers are specified.
Current usage metrics show cumulative count of Article Views (full-text article views including HTML views, PDF and ePub downloads, according to the available data) and Abstracts Views on Vision4Press platform.
Data correspond to usage on the plateform after 2015. The current usage metrics is available 48-96 hours after online publication and is updated daily on week days.
Initial download of the metrics may take a while.