Free Access
Fig. 9
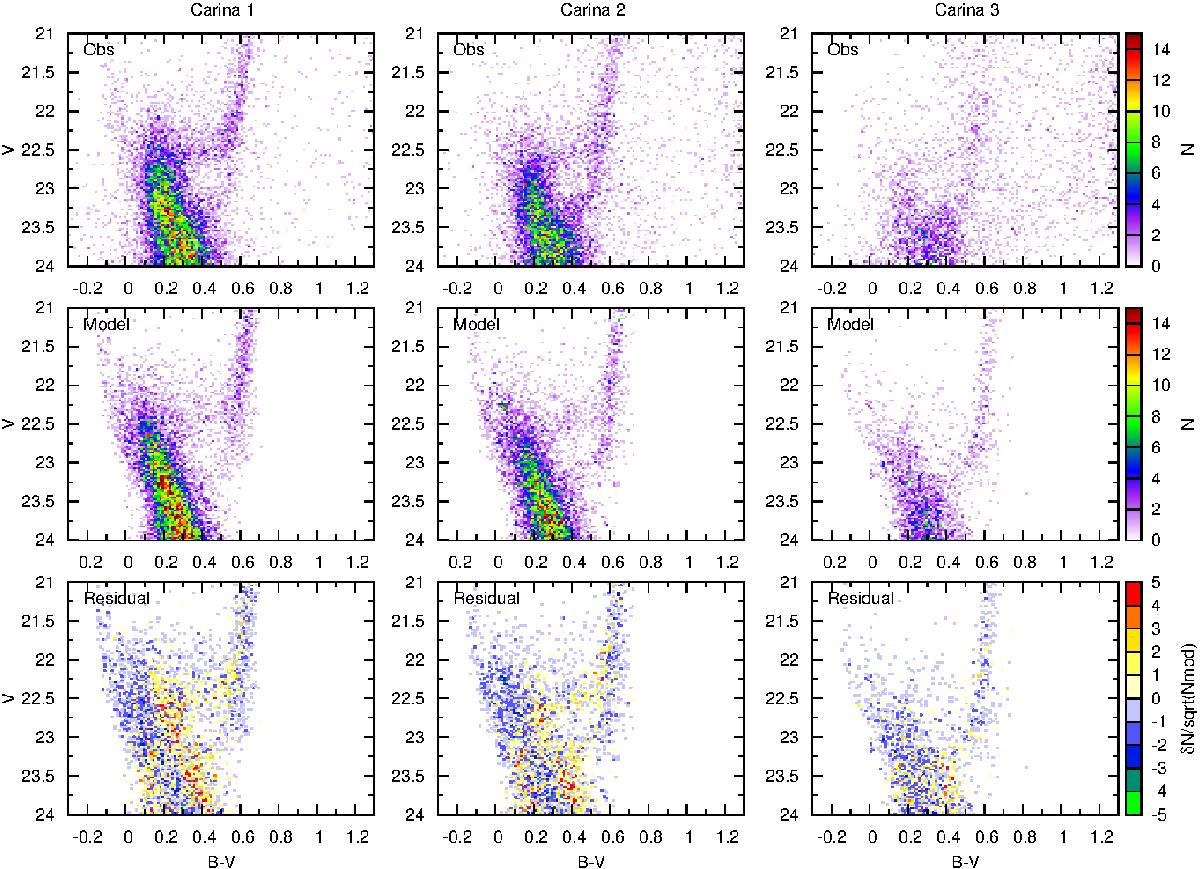
Observed (top row) and best-fitting (middle row) CMD for the different annuli within Carina. The bottom row shows the difference between the observed and best-fit CMD, expressed as a function of the uncertainty in each CMD bin.
Current usage metrics show cumulative count of Article Views (full-text article views including HTML views, PDF and ePub downloads, according to the available data) and Abstracts Views on Vision4Press platform.
Data correspond to usage on the plateform after 2015. The current usage metrics is available 48-96 hours after online publication and is updated daily on week days.
Initial download of the metrics may take a while.