Fig. 6
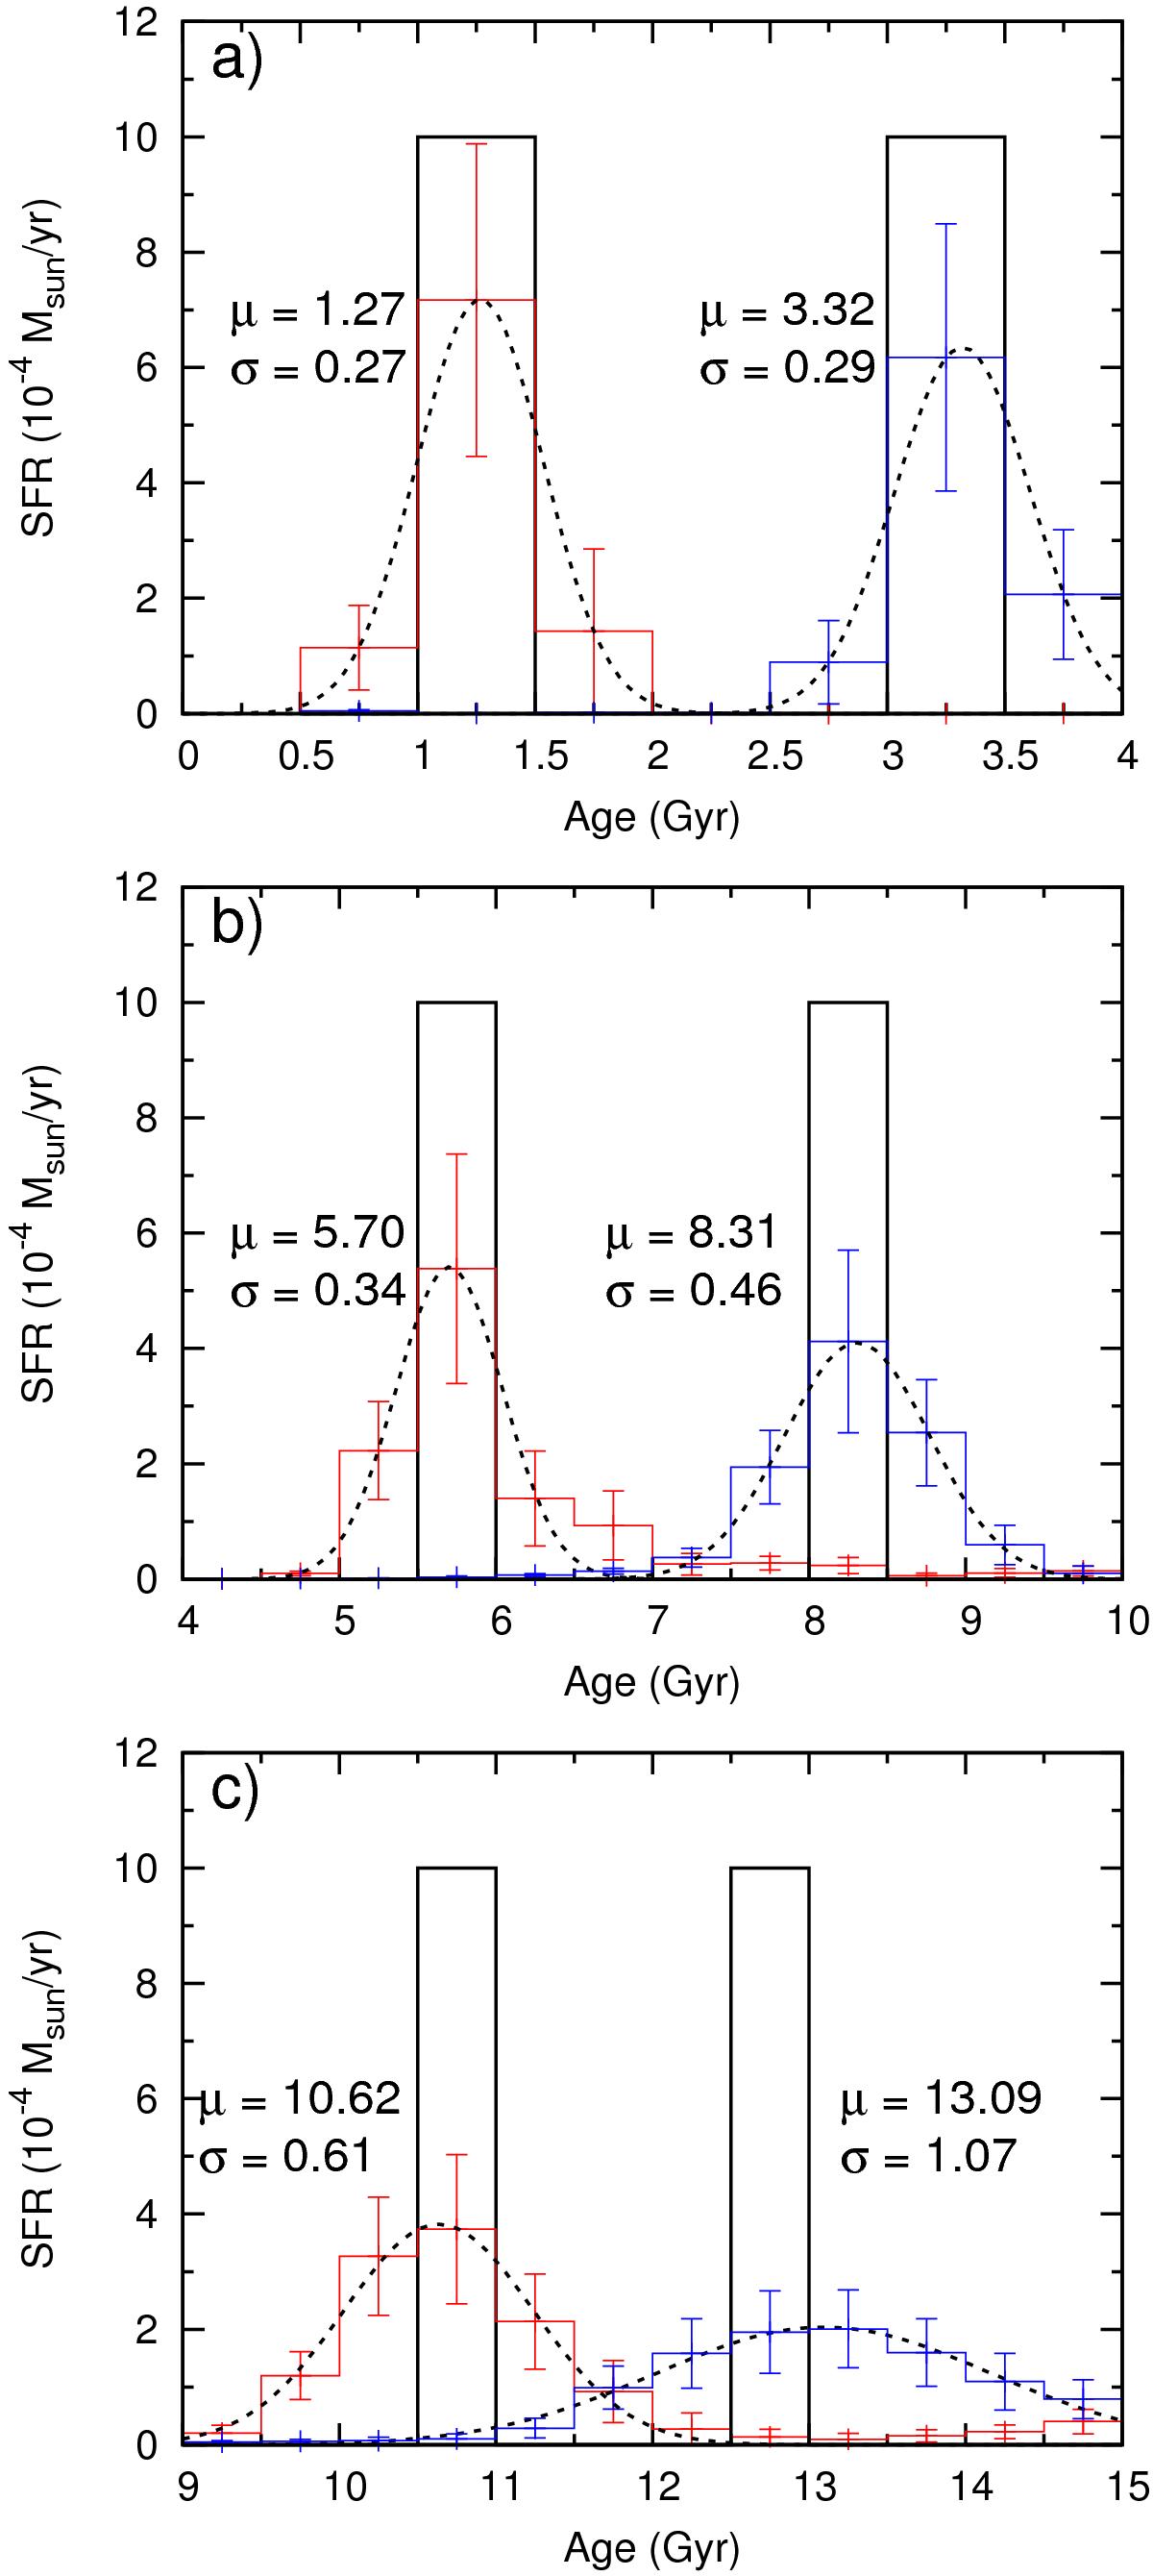
Star formation history of a series of synthetic short (10 Myr) episodes of star formation at young a), intermediate b) and old c) ages. For each burst, the black histogram shows the input SFH, given the adopted binning of the solution. The coloured histograms show the recovered SFH of the burst and the fit of a Gaussian distribution as the dashed line. The mean (μ) and variance (σ) of the fitted Gaussian distribution are also listed.
Current usage metrics show cumulative count of Article Views (full-text article views including HTML views, PDF and ePub downloads, according to the available data) and Abstracts Views on Vision4Press platform.
Data correspond to usage on the plateform after 2015. The current usage metrics is available 48-96 hours after online publication and is updated daily on week days.
Initial download of the metrics may take a while.