Fig. 3
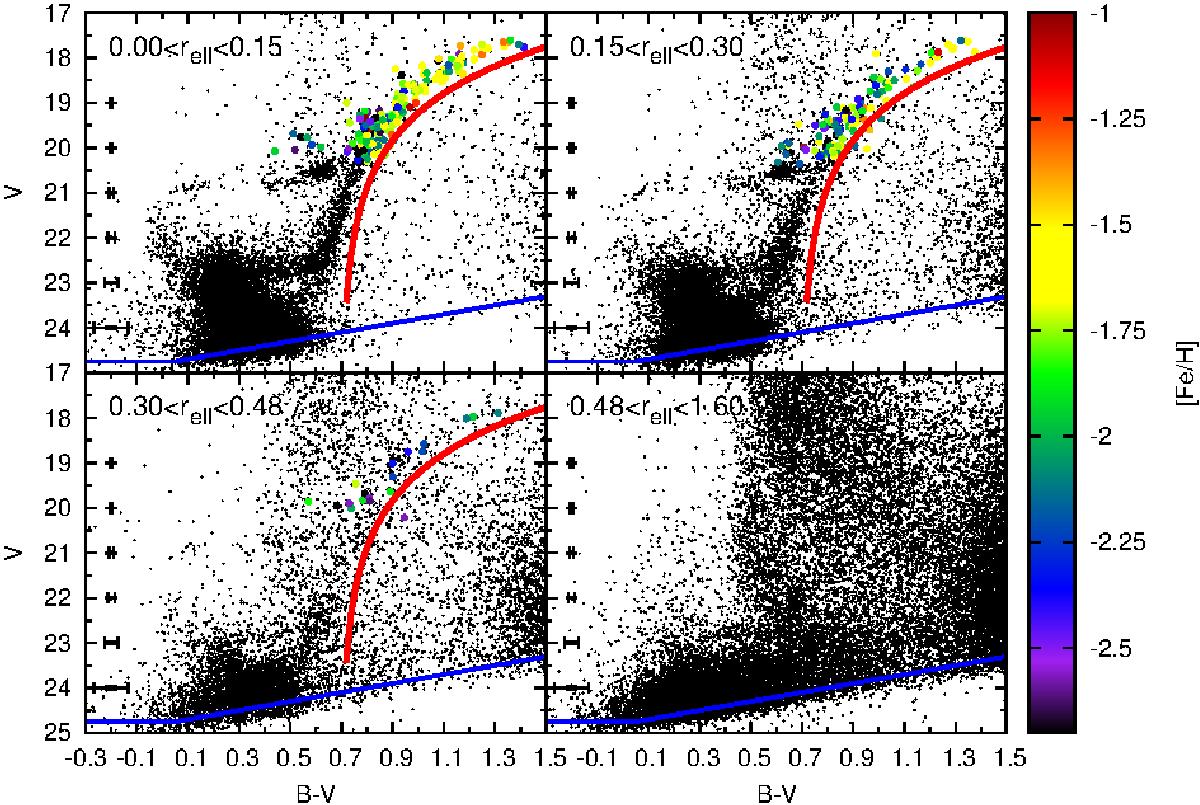
(V, B − V) CMDs of the Carina dSph at different radius from the centre, as shown in Fig. 1. The [Fe/H] determinations of individual RGB stars from Starkenburg et al. (2010) are also shown as large coloured circles, with colour indicating the [Fe/H] abundance. The average photometric error at each magnitude level are represented by the horizontal error bars and the 50% completeness level is indicated by the solid (blue) line. Furthermore, the red line indicates the colour limit for lower RGB stars associated with Carina.
Current usage metrics show cumulative count of Article Views (full-text article views including HTML views, PDF and ePub downloads, according to the available data) and Abstracts Views on Vision4Press platform.
Data correspond to usage on the plateform after 2015. The current usage metrics is available 48-96 hours after online publication and is updated daily on week days.
Initial download of the metrics may take a while.