Fig. 10
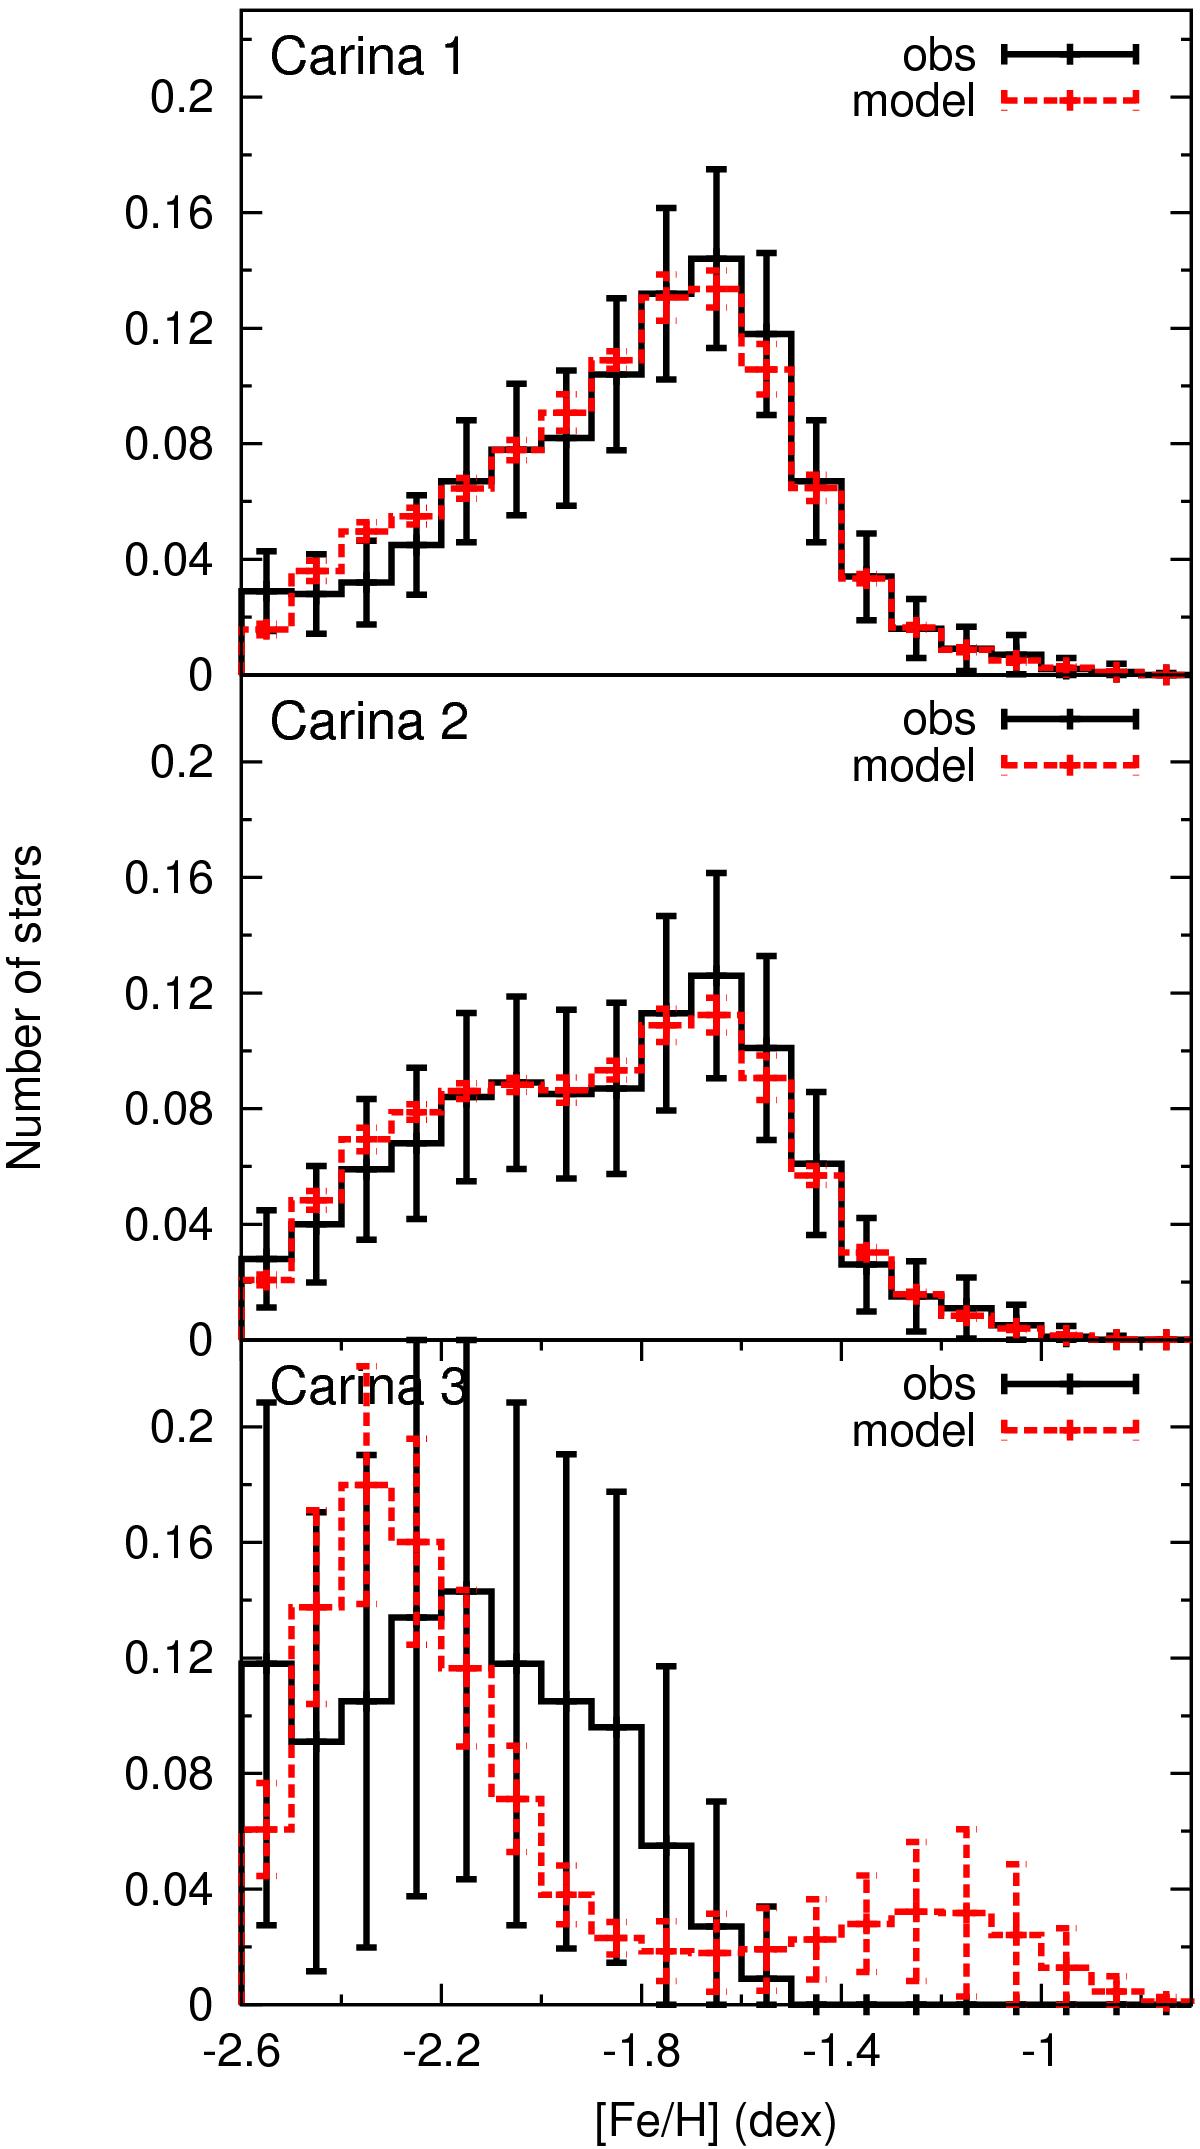
Normalised metallicity distribution function for each of the three annuli within the tidal radius of Carina. The observed MDF is shown as black lines, while the best-fit result from the SFH derivation is shown in red. The error bars indicate the uncertainties on the MDF due to uncertainties on the SFH for the model and due to Poissonian errors for the observations.
Current usage metrics show cumulative count of Article Views (full-text article views including HTML views, PDF and ePub downloads, according to the available data) and Abstracts Views on Vision4Press platform.
Data correspond to usage on the plateform after 2015. The current usage metrics is available 48-96 hours after online publication and is updated daily on week days.
Initial download of the metrics may take a while.