Fig. 8
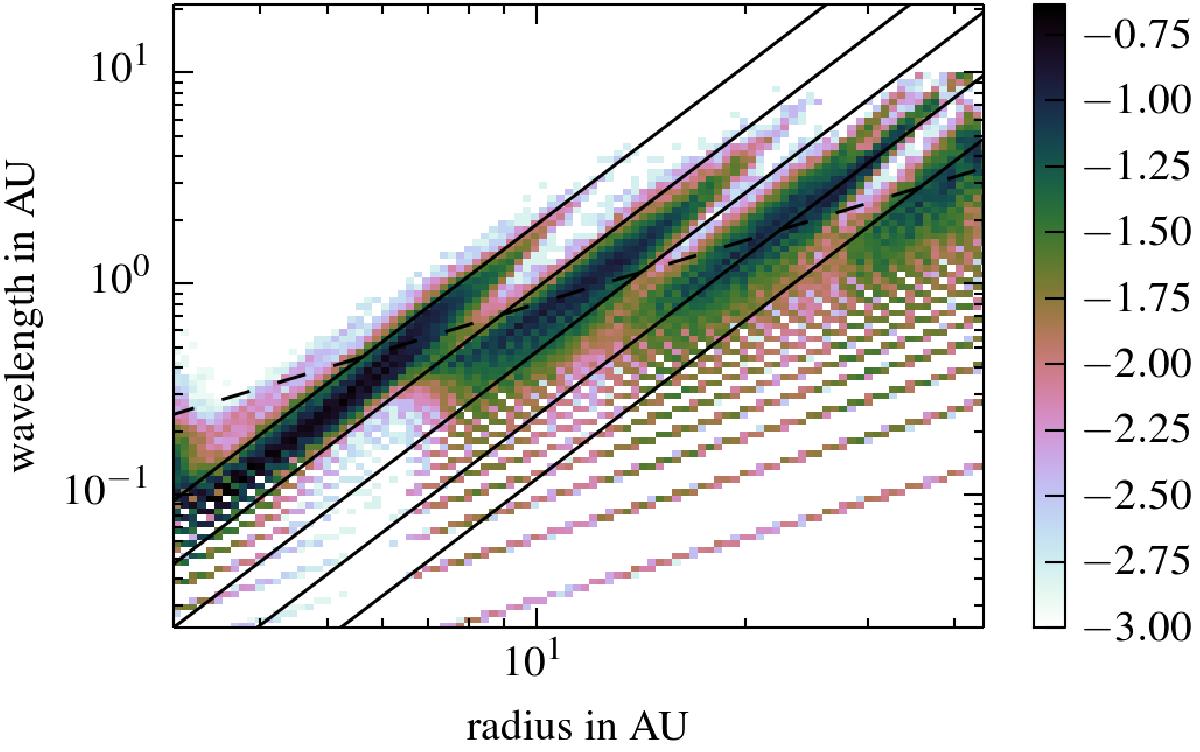
Histogram: colour coded is the logarithm of the probability for the occurrence of a wavelength at a radius normalised at each radius by the sum of all wavelengths for the specific radius. The black lines are proportional to the radius to the power of 2.5 and the lines are a factor of 2 apart from each other. The dashed line has linear slope. One can see that the instability jumps successively between different modes for the wavelength with corresponding jumps in frequency at the same radius.
Current usage metrics show cumulative count of Article Views (full-text article views including HTML views, PDF and ePub downloads, according to the available data) and Abstracts Views on Vision4Press platform.
Data correspond to usage on the plateform after 2015. The current usage metrics is available 48-96 hours after online publication and is updated daily on week days.
Initial download of the metrics may take a while.