Fig. 6
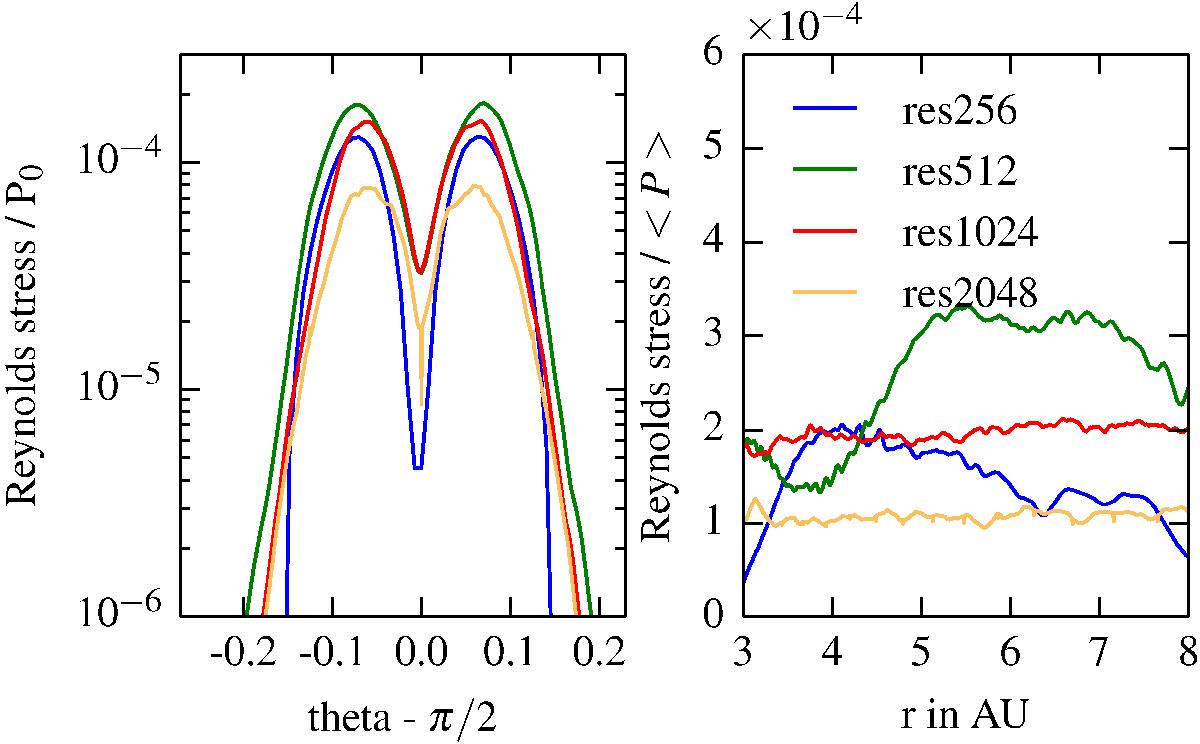
Radial and vertical distribution of the Reynolds stress. Left: the Reynolds stress divided by the midplane pressure over the vertical direction. Right: reynolds stress divided by the mean pressure over the radius for different resolutions. Both are averaged over 4001 time steps from orbit 1000 to 5000. The model res2048 corresponds to the results shown in Fig. 1.
Current usage metrics show cumulative count of Article Views (full-text article views including HTML views, PDF and ePub downloads, according to the available data) and Abstracts Views on Vision4Press platform.
Data correspond to usage on the plateform after 2015. The current usage metrics is available 48-96 hours after online publication and is updated daily on week days.
Initial download of the metrics may take a while.