Free Access
Fig. 10
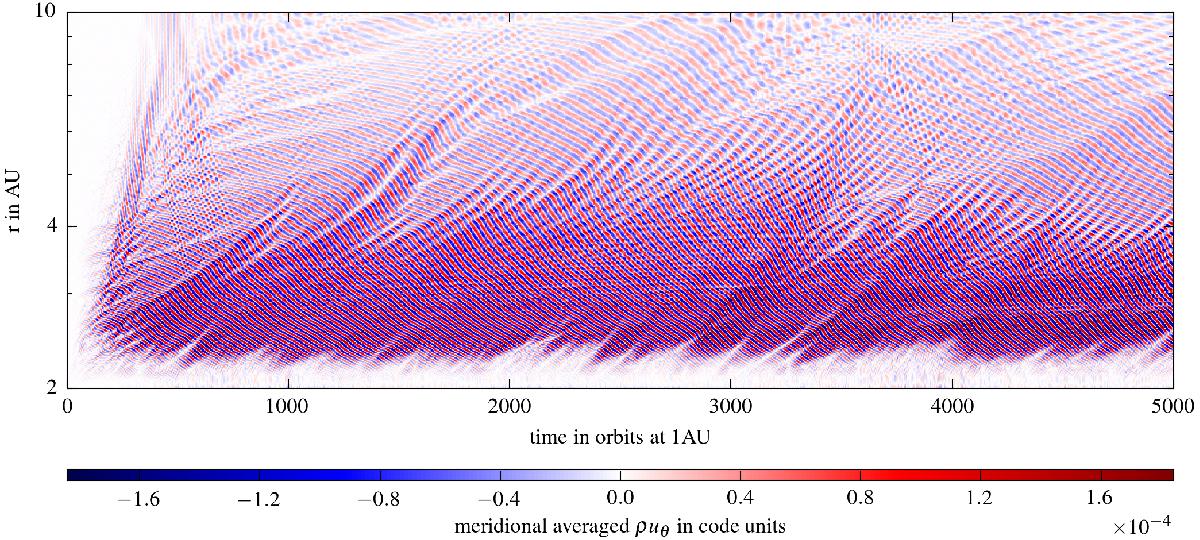
Large scale time development of the instability. Shown is the vertically averaged momentum in the meridional direction for the inviscid isothermal simulation with a resolution of 1024 × 256 (red curve in top panel of Fig. 7).
Current usage metrics show cumulative count of Article Views (full-text article views including HTML views, PDF and ePub downloads, according to the available data) and Abstracts Views on Vision4Press platform.
Data correspond to usage on the plateform after 2015. The current usage metrics is available 48-96 hours after online publication and is updated daily on week days.
Initial download of the metrics may take a while.