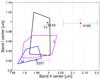
Fig. 3
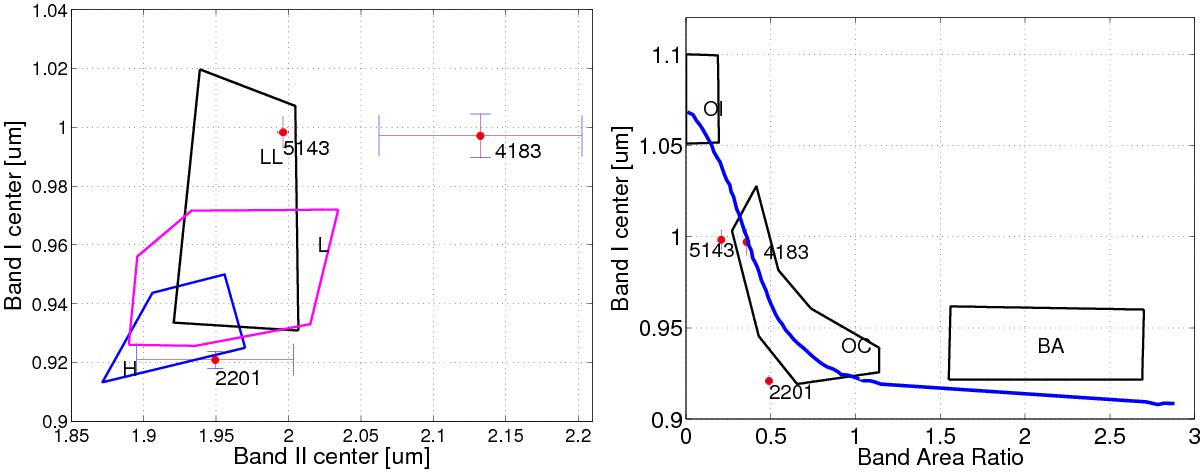
Left: wavelength position of the centers of the two absorption bands computed using Cloutis et al. (1986). The enclosed regions correspond to the band centers computed for the H, L, and LL chondrites, respectively (de León et al. 2010). Right: band area ratio (BAR) versus band I centers. The regions enclosed by continuous lines correspond to the values computed for basaltic achondrites, ordinary chondrites (OC), and olivine-rich meteorites (Ol) (Gaffey et al. 1993).
Current usage metrics show cumulative count of Article Views (full-text article views including HTML views, PDF and ePub downloads, according to the available data) and Abstracts Views on Vision4Press platform.
Data correspond to usage on the plateform after 2015. The current usage metrics is available 48-96 hours after online publication and is updated daily on week days.
Initial download of the metrics may take a while.