Fig. 6
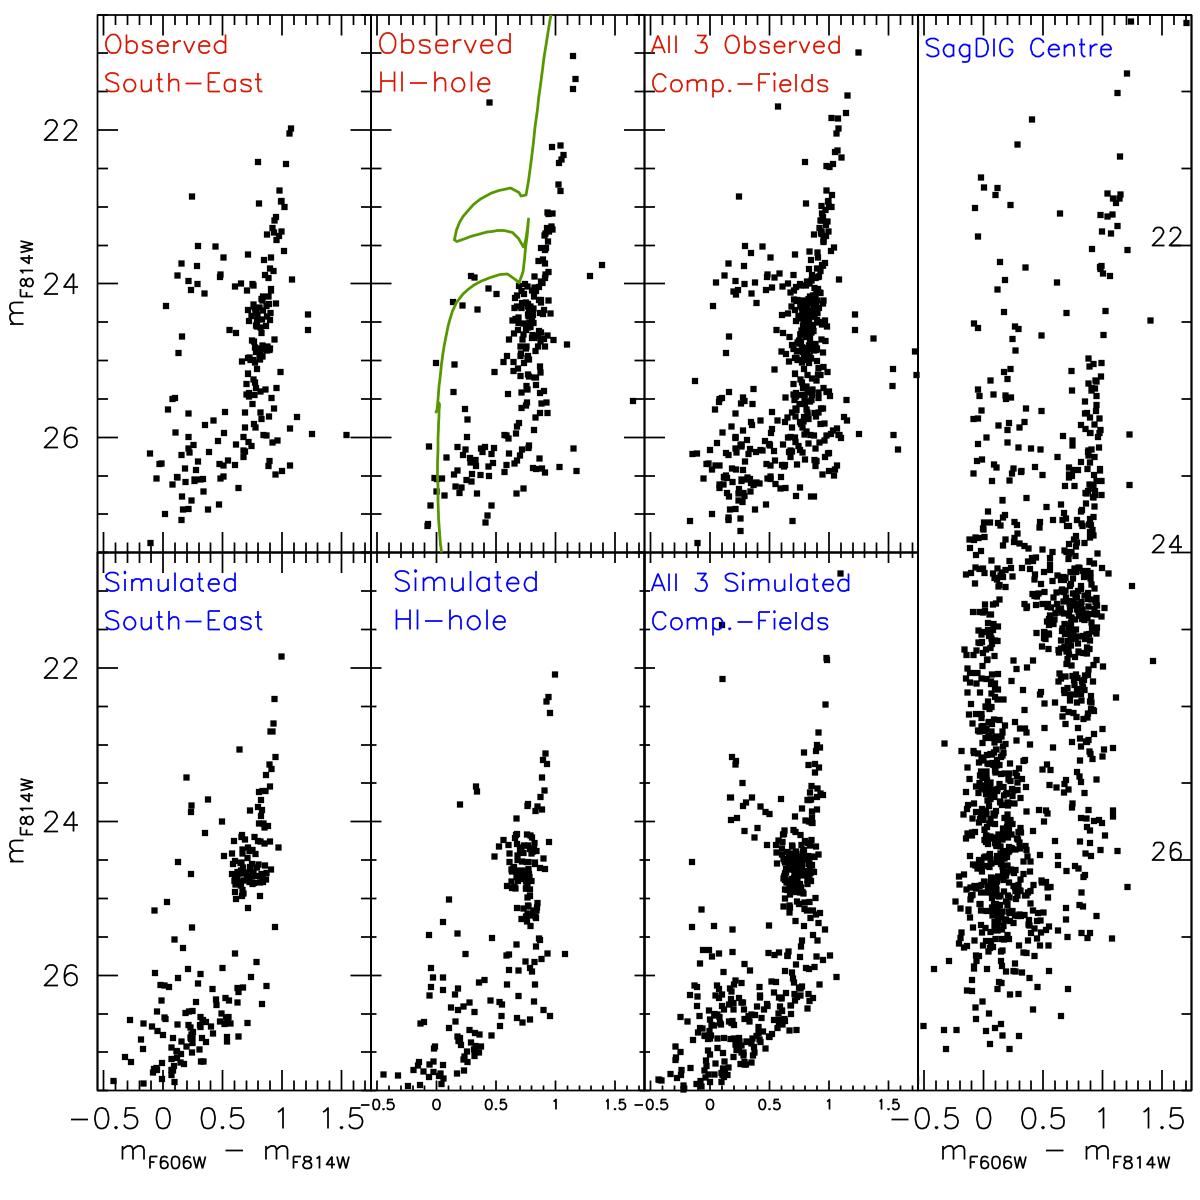
From left to right: color–magnitude diagrams of the selected (see text) southeast, H i hole and all three comparison fields put together. The rightmost panel displays an equal-area elliptical selection around the SagDIG center, showing the abundant presence of MS and BSG stellar populations. Also plotted is a Z = 0.0004, 0.355 Gyr old isochrone.
Current usage metrics show cumulative count of Article Views (full-text article views including HTML views, PDF and ePub downloads, according to the available data) and Abstracts Views on Vision4Press platform.
Data correspond to usage on the plateform after 2015. The current usage metrics is available 48-96 hours after online publication and is updated daily on week days.
Initial download of the metrics may take a while.