Fig. 5
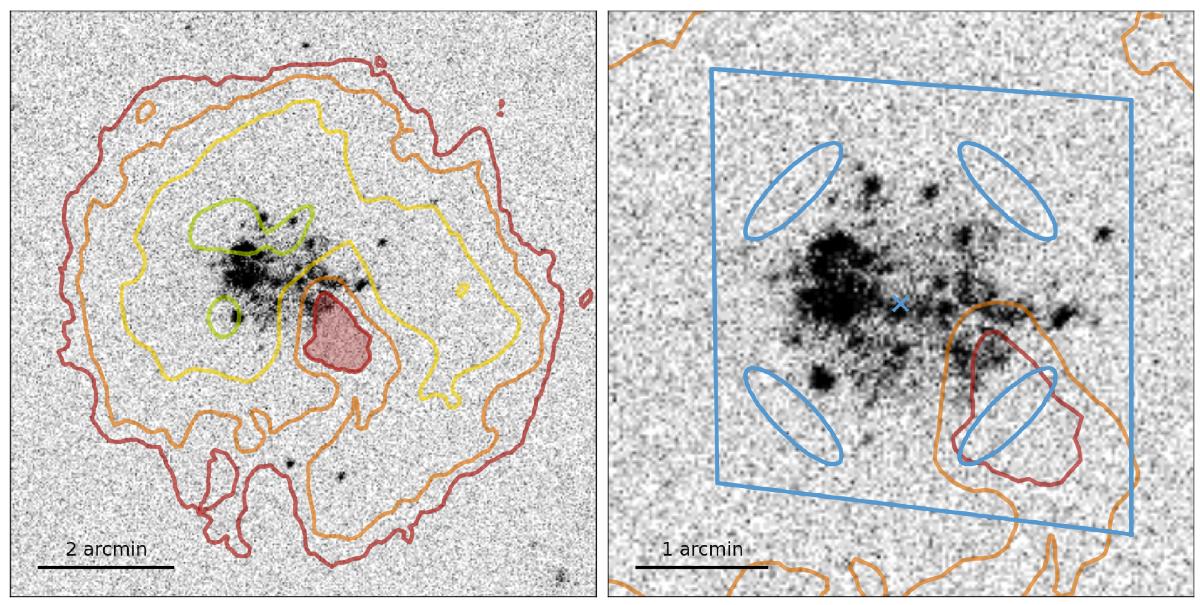
GALEX far-ultraviolet image of SagDIG upon which the H i contours are overplotted. The 3 highest density H i clumps are the inner, open (green) contours, while the H i hole is highlighted as a shaded region. The right panel displays a closer view on the main body of SagDIG highlighting (i) the quadrangle HST/ACS field of view; (ii) the SagDIG derived center (see text) marked by a cross; and (iii) the 4 equidistant elliptical regions; used to extract and compare the stellar populations in the H i hole and the surrounding comparison fields.
Current usage metrics show cumulative count of Article Views (full-text article views including HTML views, PDF and ePub downloads, according to the available data) and Abstracts Views on Vision4Press platform.
Data correspond to usage on the plateform after 2015. The current usage metrics is available 48-96 hours after online publication and is updated daily on week days.
Initial download of the metrics may take a while.