Fig. 1
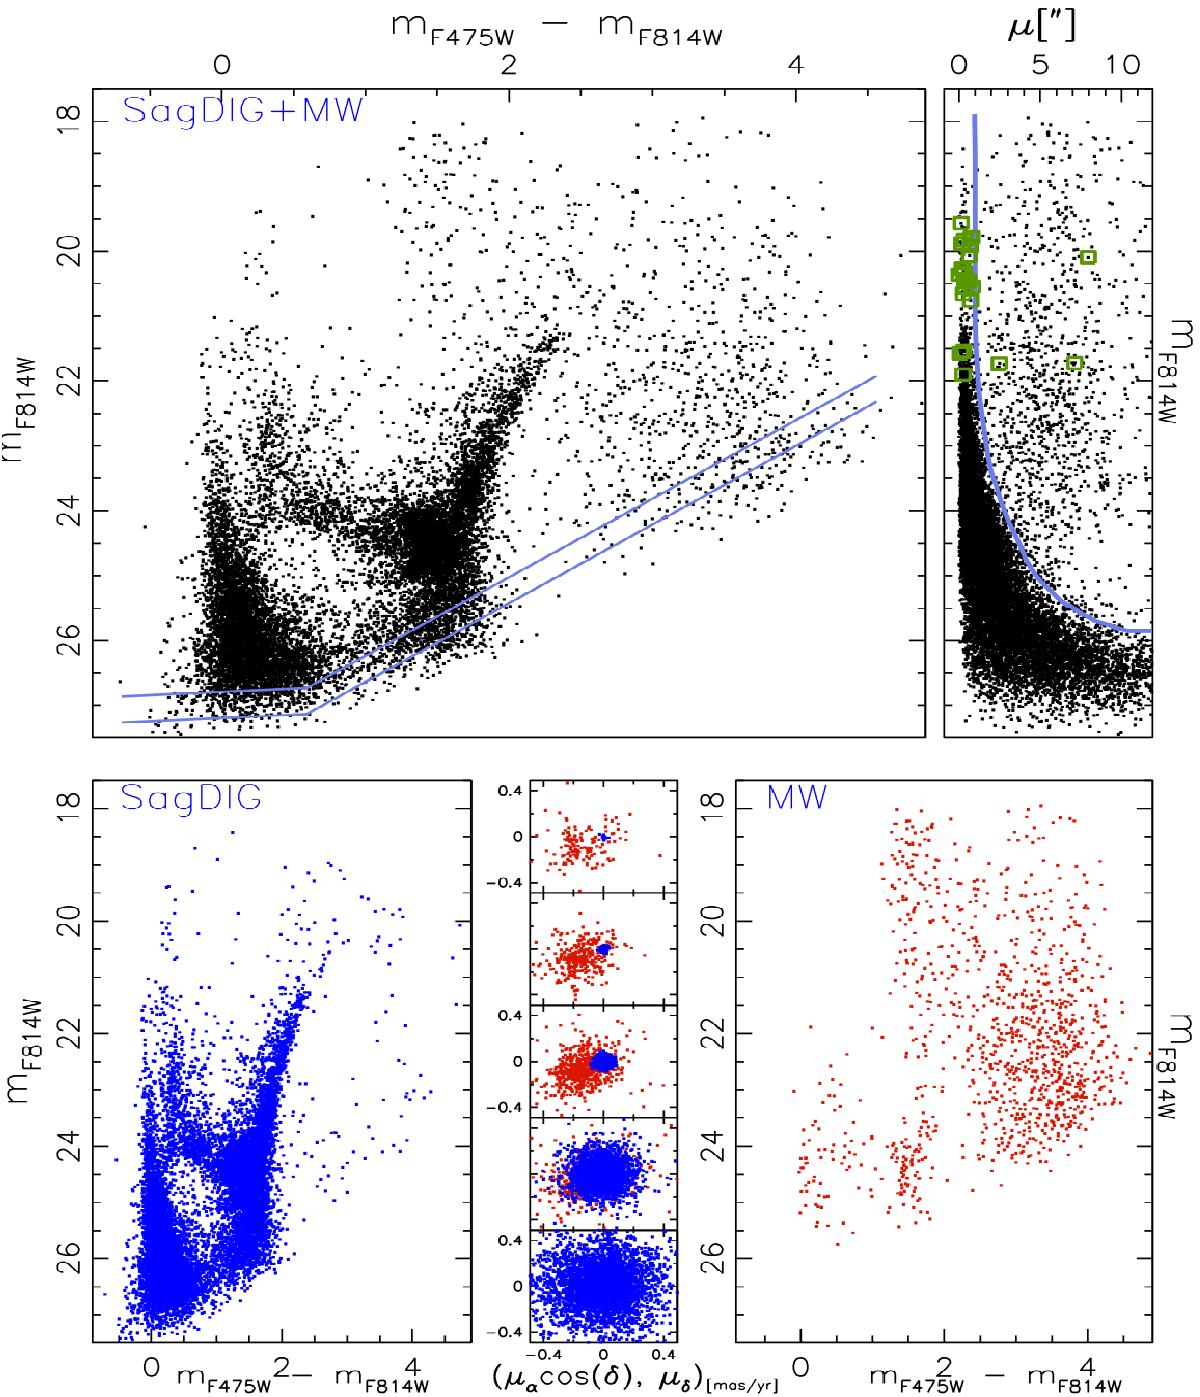
Upper left panel: Momany et al. (2005) color–magnitude diagram along with the 80% and 50% photometric incompleteness levels. Upper right panel: μ′′ (see text) as a function of mF814W, where open squares highlight the position of the identified carbon stars and the heavy blue line marks the separation between SagDIG and foreground stellar populations. Lower panels: resulting proper-motion separated diagrams of SagDIG and the Galactic foreground populations. Lower middle panel: 5 vector-point diagrams, in bins of 2.0 mag per subpanel, starting with mF606W = 18.0. SagDIG selected members are highlighted as blue points whereas Galactic foreground is plotted in red.
Current usage metrics show cumulative count of Article Views (full-text article views including HTML views, PDF and ePub downloads, according to the available data) and Abstracts Views on Vision4Press platform.
Data correspond to usage on the plateform after 2015. The current usage metrics is available 48-96 hours after online publication and is updated daily on week days.
Initial download of the metrics may take a while.