Fig. 4
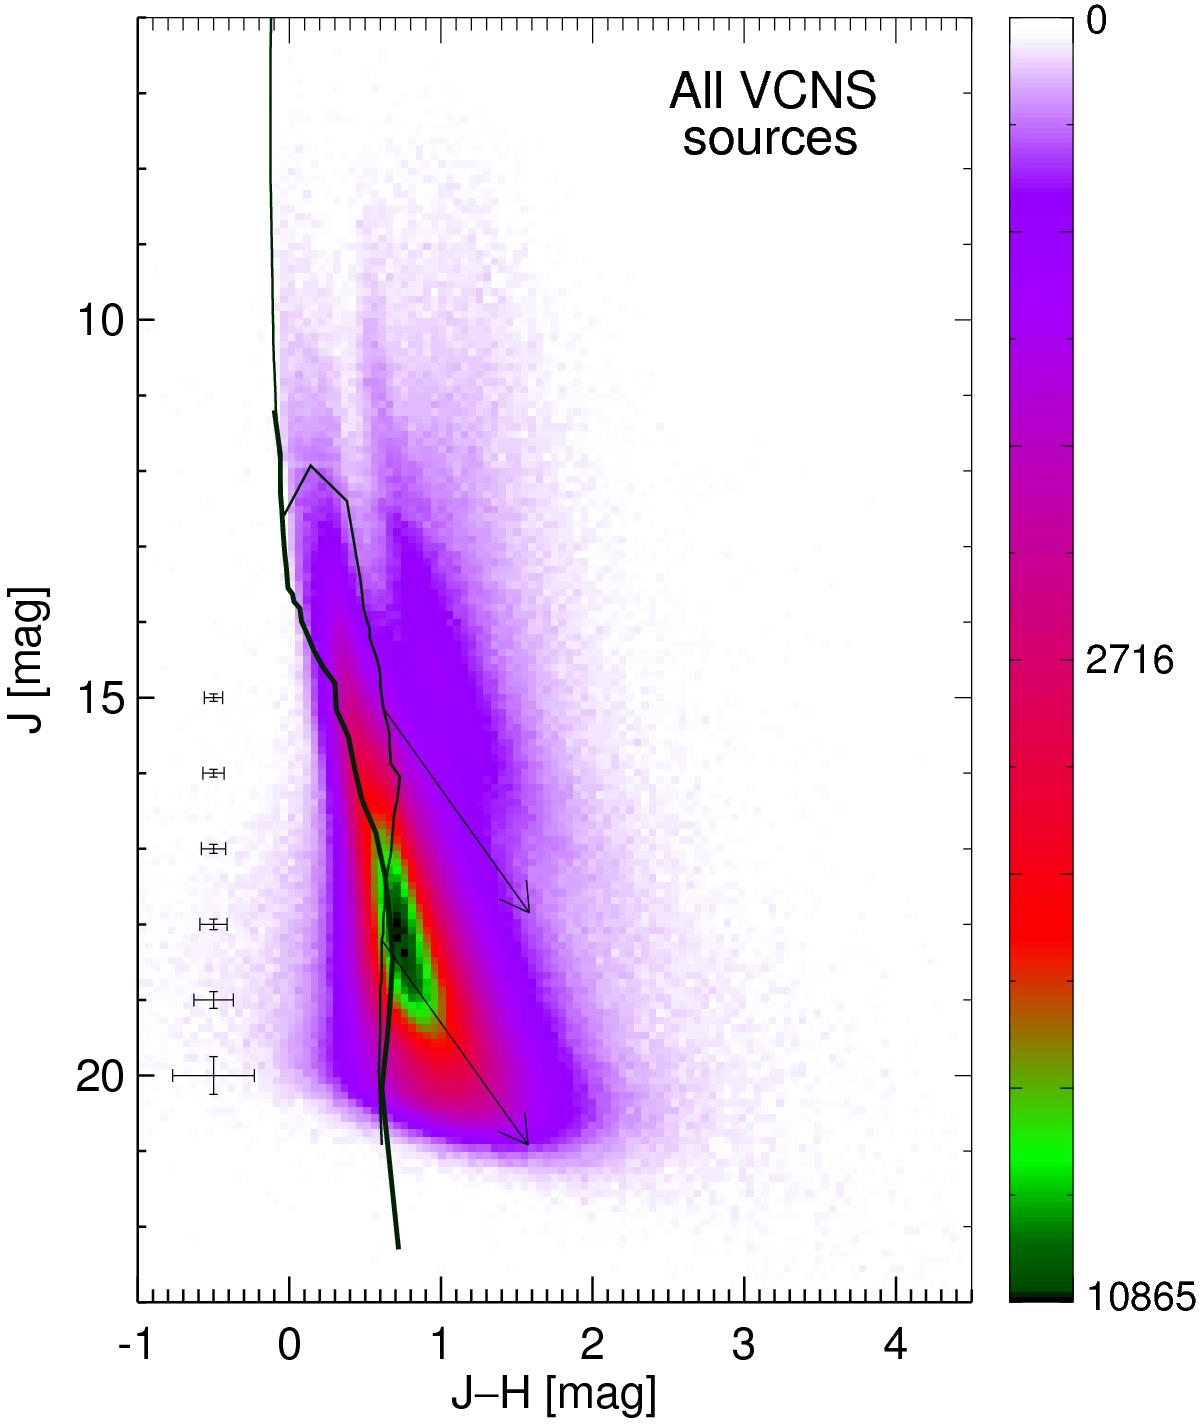
Hess diagram of the color-magnitude distribution of all objects in the VCNS catalog. The color indicates the number of objects in each bin with a size of 0.05 mag in J − H and 0.1 mag in J, using a square-root intensity scale. The thick solid line shows the ZAMS from Siess et al. (2000) at the distance of the Carina Nebula (2.3 kpc), while the thin line shows the 3 Myr (the typical mean age of the young stellar population in the Carina Nebula; see Getman et al. 2014) isochrone composed from the models of Baraffe et al. (1998) for the mass range 0.02 to 0.5 M⊙, Siess et al. (2000) for the mass range 0.5 to 7 M⊙, and Lejeune & Schaerer (2001) (model iso-c020-0650) for the mass range 7 to 70 M⊙. The arrows indicate reddening vectors for AV = 10 mag (assuming AJ = 0.271 AV and AH = 0.175 AV; Draine 2011) starting at the location of 3 Myr old stars with masses of 1 M⊙, and 0.1 M⊙. The row of error bars in the left part of the plot shows the typical magnitude-dependent photometric uncertainties.
Current usage metrics show cumulative count of Article Views (full-text article views including HTML views, PDF and ePub downloads, according to the available data) and Abstracts Views on Vision4Press platform.
Data correspond to usage on the plateform after 2015. The current usage metrics is available 48-96 hours after online publication and is updated daily on week days.
Initial download of the metrics may take a while.