Fig. 2
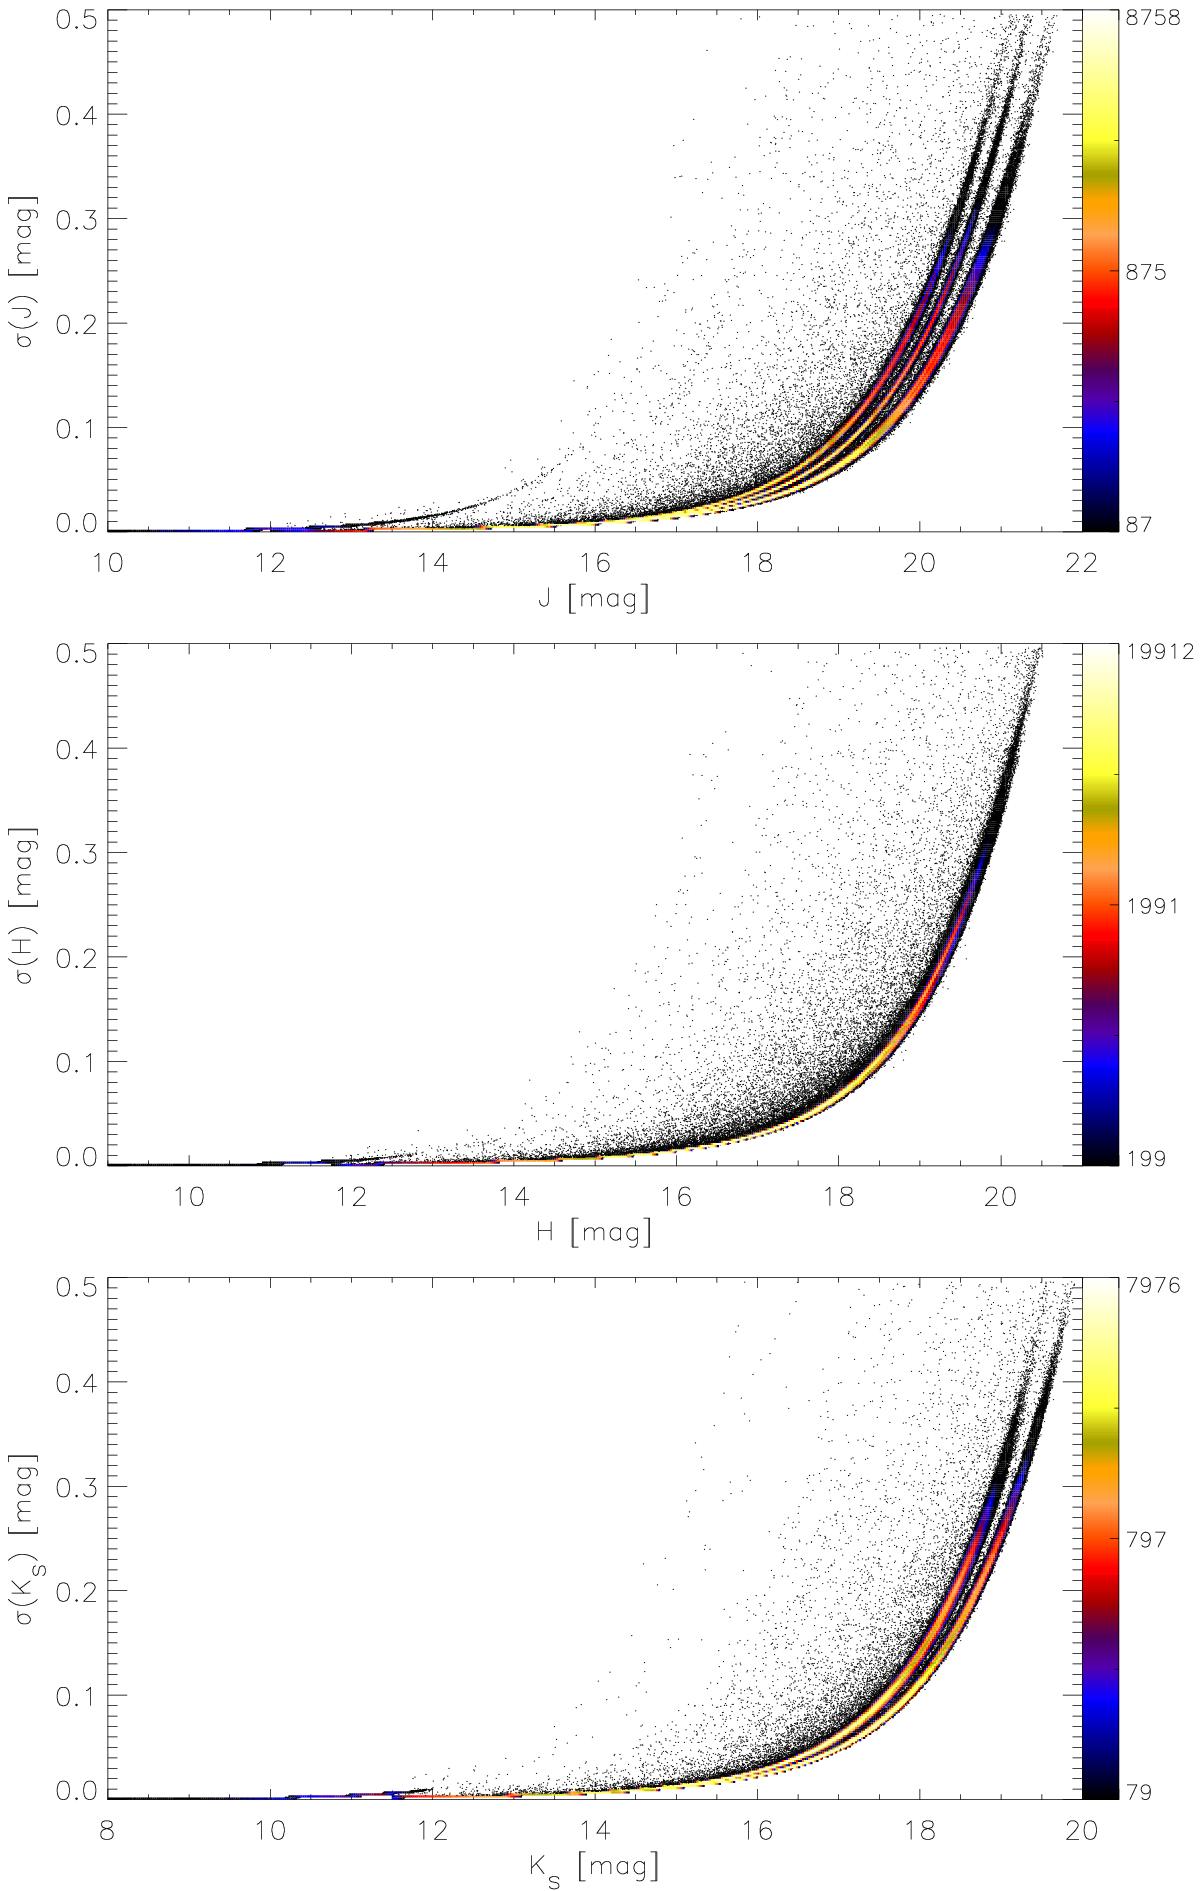
Hess diagrams for the distribution of the uncertainties in the source magnitudes as a function of the source magnitude for the J-band (top), the H-band (middle), and the Ks-band (bottom). The color scale shows the number of objects in 2D bins with a size of 0.025 mag on the x-axis and 0.002 mag on the y-axis. In all bins with fewer objects than the lower limit indicated at the bottom of the color bar, the individual objects are plotted by black dots.
Current usage metrics show cumulative count of Article Views (full-text article views including HTML views, PDF and ePub downloads, according to the available data) and Abstracts Views on Vision4Press platform.
Data correspond to usage on the plateform after 2015. The current usage metrics is available 48-96 hours after online publication and is updated daily on week days.
Initial download of the metrics may take a while.