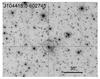
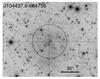
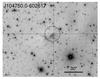
Fig. 12
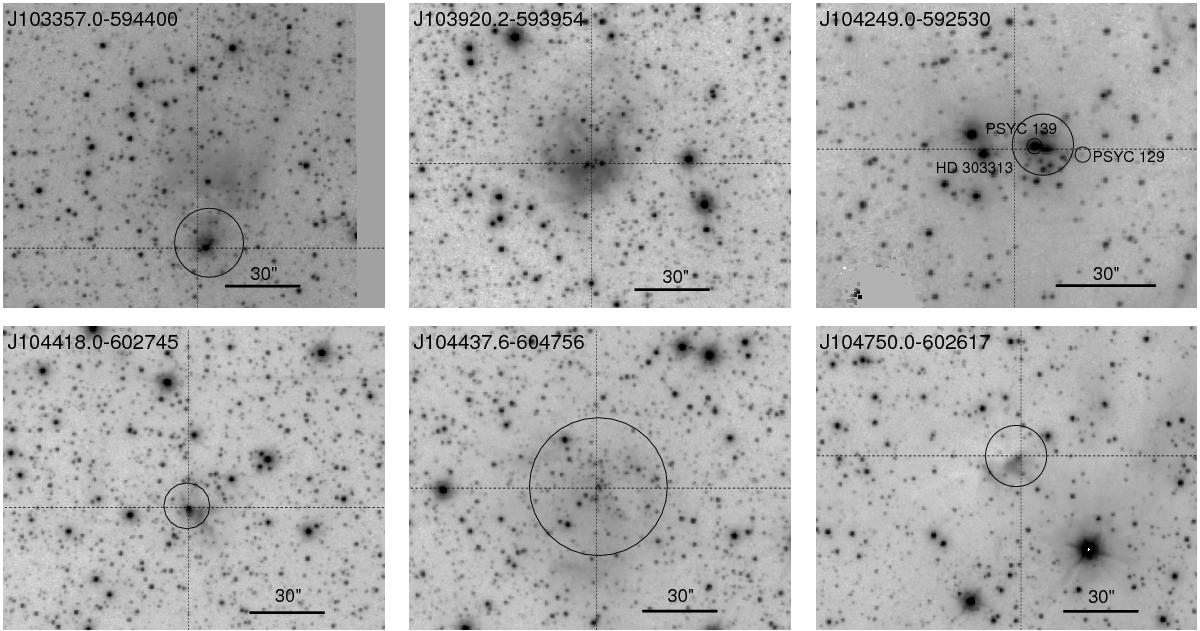
Negative grayscale representation of Ks-band VISTA images of selected clusters in the area. A logarithmic intensity scale is used to show the faint stars and weak nebulosity. North is up and east to the left. The vertical and horizontal lines show the right ascension and declination as given in the upper left corner of each image. The circles mark the position of the cloud clumps and objects as described in the text.
Current usage metrics show cumulative count of Article Views (full-text article views including HTML views, PDF and ePub downloads, according to the available data) and Abstracts Views on Vision4Press platform.
Data correspond to usage on the plateform after 2015. The current usage metrics is available 48-96 hours after online publication and is updated daily on week days.
Initial download of the metrics may take a while.