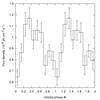
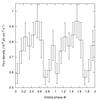
Fig. 4
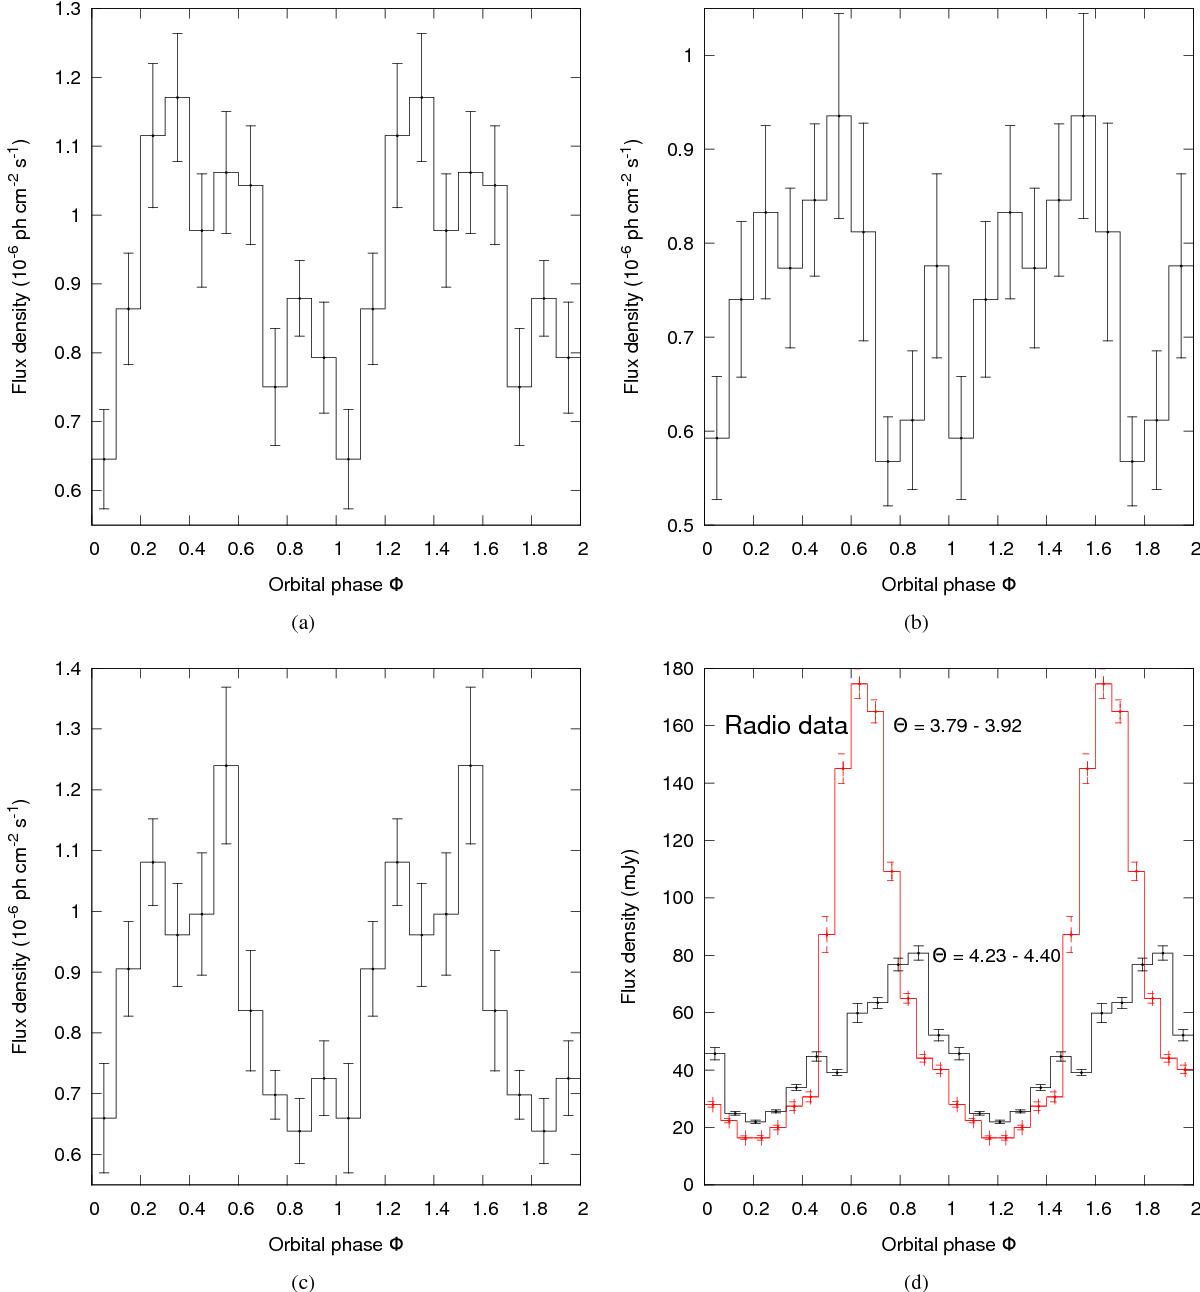
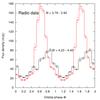
Apoastron peak. Fermi-LAT gamma-ray data folded with the orbital periodicity for three consecutive Θ-intervals. a)Θ = 7.12−7.22 (MJD 55 235−55 402); b) Θ = 7.22−7.32 (MJD 55 402−55 569); c) Θ = 7.32−7.42 (MJD 55 569−55 740). d) GBI radio data at 8 GHz folded with orbital period . The two Θ-intervals are those considered in Fig. 1 and in this figure for Fermi-LAT data. The orbital phase of the peak of the two radio curves agrees well with those of the second peak in GeV curves.
Current usage metrics show cumulative count of Article Views (full-text article views including HTML views, PDF and ePub downloads, according to the available data) and Abstracts Views on Vision4Press platform.
Data correspond to usage on the plateform after 2015. The current usage metrics is available 48-96 hours after online publication and is updated daily on week days.
Initial download of the metrics may take a while.