Fig. 3
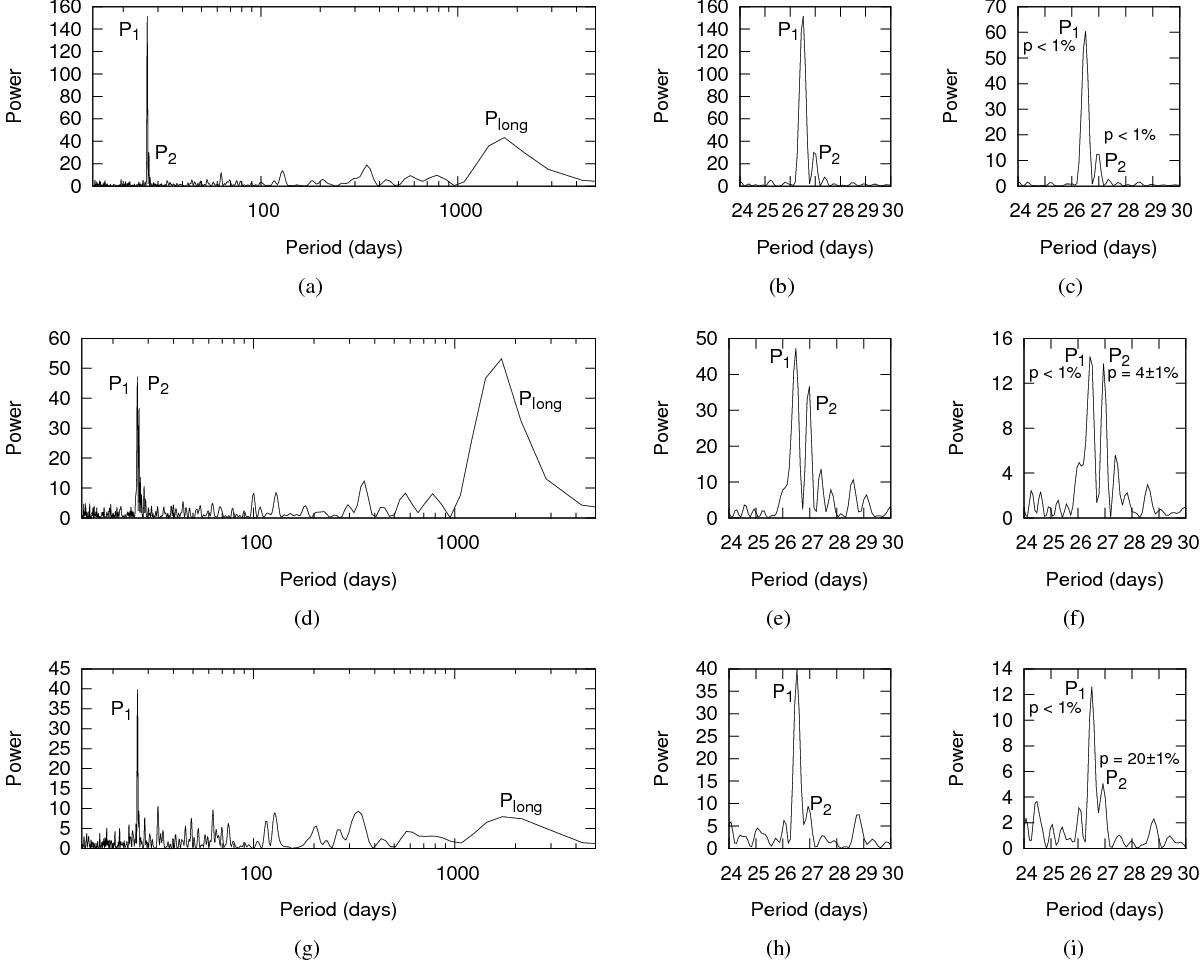
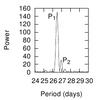
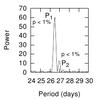
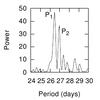
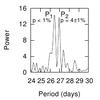
Lomb-Scargle periodogram of the Fermi-LAT (with a time bin of one day). a) Full data set: data in the orbital phase Φ = 0.0−1.0. b) Zoom of Fig. 3a. c) Same as 3b for data with a time bin of 5 d. The false alarm probability (p) resulting from randomisation tests is indicated. A period is defined as significant for p< 1%, and as marginally significant for 1% <p< 10% (Sect. 2). d) Half the data set: data in the orbital phase Φ = 0.5−1.0. The periods P2 and Plong here present are typical periodicities in radio data (Massi & Jaron 2013). e) Zoom of Fig. 3d. f) Same as 3e for data with a time bin of 5 d. g) Half the data set: data in the orbital phase Φ = 0.0−0.5. h) Zoom of Fig. 3g. i) Same as 3h for data with a time bin of 5 d.
Current usage metrics show cumulative count of Article Views (full-text article views including HTML views, PDF and ePub downloads, according to the available data) and Abstracts Views on Vision4Press platform.
Data correspond to usage on the plateform after 2015. The current usage metrics is available 48-96 hours after online publication and is updated daily on week days.
Initial download of the metrics may take a while.


