Fig. 2
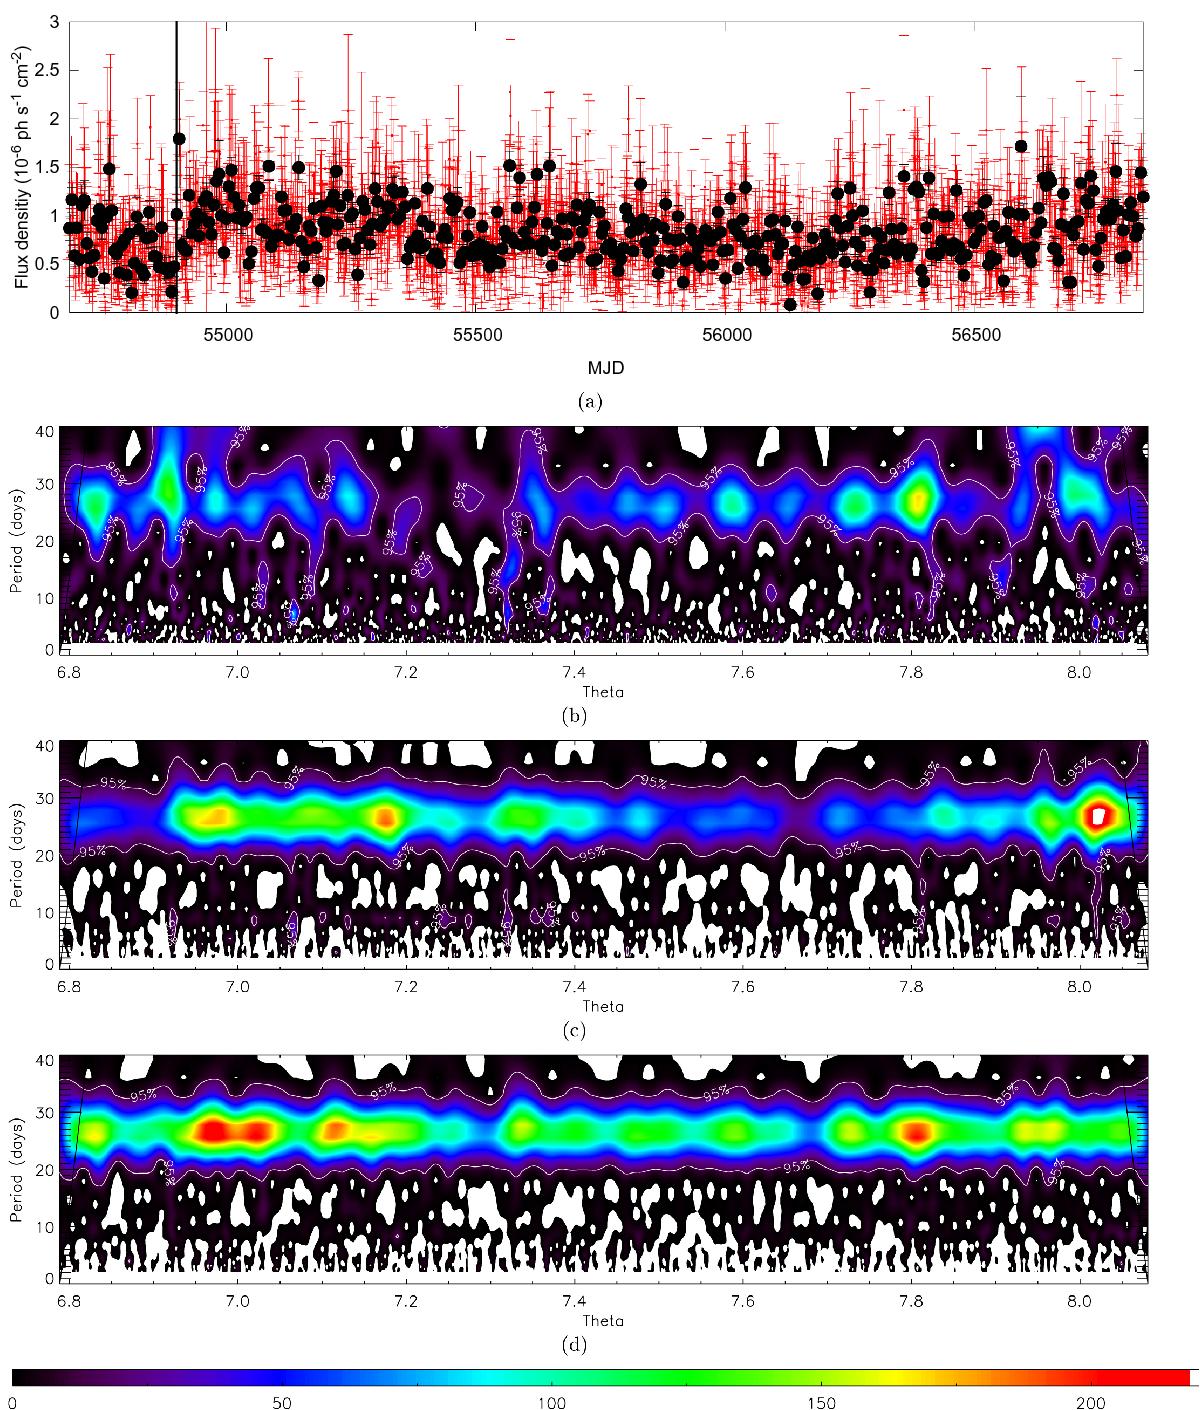
Wavelet analysis of Fermi-LAT data. The strength of periodicity is colour–coded as indicated in the bottom bar. a) Fermi-LAT data with a time bin of 5 d (black) are overplotted on Fermi-LAT data with a time bin of 1 d (red). The black line marks the point of flux change reported by Hadasch et al. (2012) which is also visible in our light curve. b) Wavelet analysis for the whole data set, that is for the whole orbital interval 0.0−1.0 (b)–d) use a time bin of one day). c) Wavelet analysis for half the data set, that is for the orbital interval Φ = 0.5−1.0, i.e., around apoastron. d) Wavelet for half the data set, that is for the orbital interval Φ = 0.0−0.5, i.e., around periastron.
Current usage metrics show cumulative count of Article Views (full-text article views including HTML views, PDF and ePub downloads, according to the available data) and Abstracts Views on Vision4Press platform.
Data correspond to usage on the plateform after 2015. The current usage metrics is available 48-96 hours after online publication and is updated daily on week days.
Initial download of the metrics may take a while.