Fig. 6
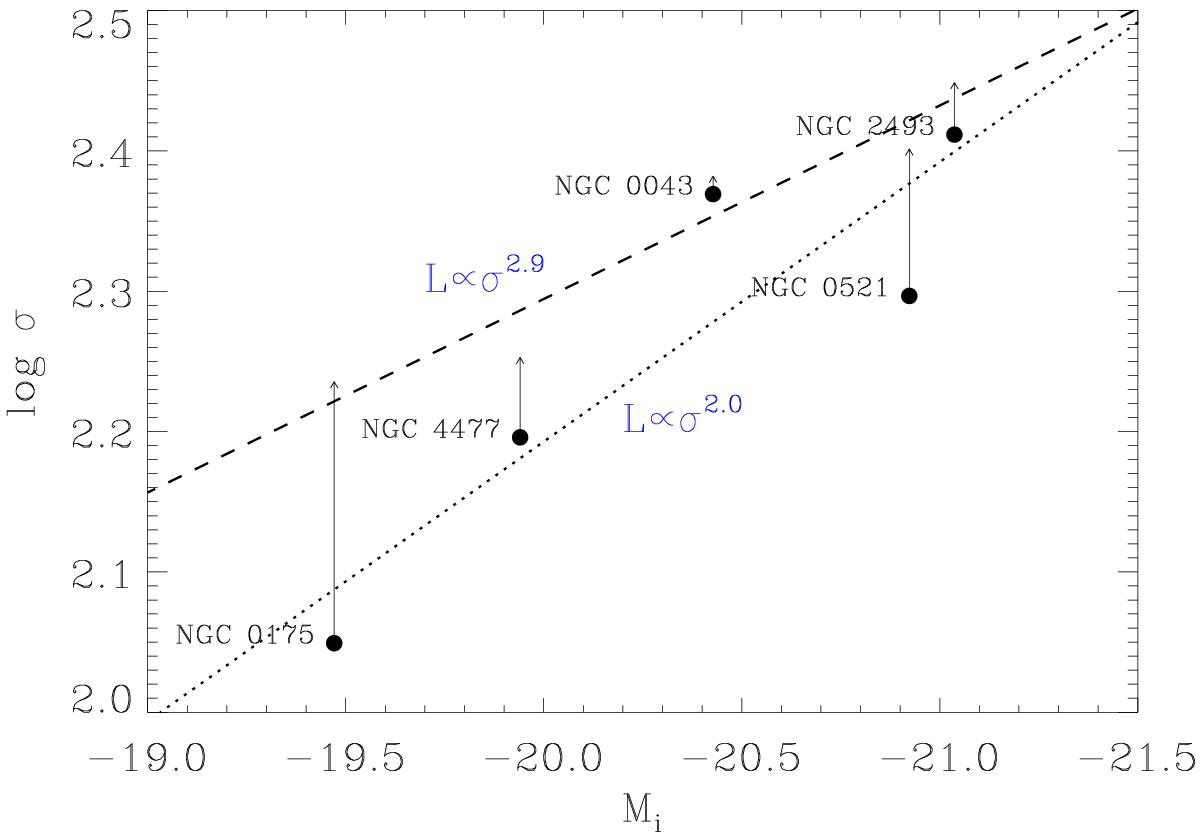
Faber-Jackson relation obtained for the five bulges of the sample with i-band SDSS photometry. Black dots represent the measured values of σre/ 8, whereas the head of the arrow marks the model-corrected values of σre/ 8 obtained from the exponential fit to the velocity dispersion radial profile. Dotted and dashed lines represent the fits to the measured and model-corrected FJ relations, respectively.
Current usage metrics show cumulative count of Article Views (full-text article views including HTML views, PDF and ePub downloads, according to the available data) and Abstracts Views on Vision4Press platform.
Data correspond to usage on the plateform after 2015. The current usage metrics is available 48-96 hours after online publication and is updated daily on week days.
Initial download of the metrics may take a while.