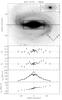
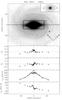
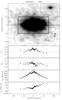
Fig. 2
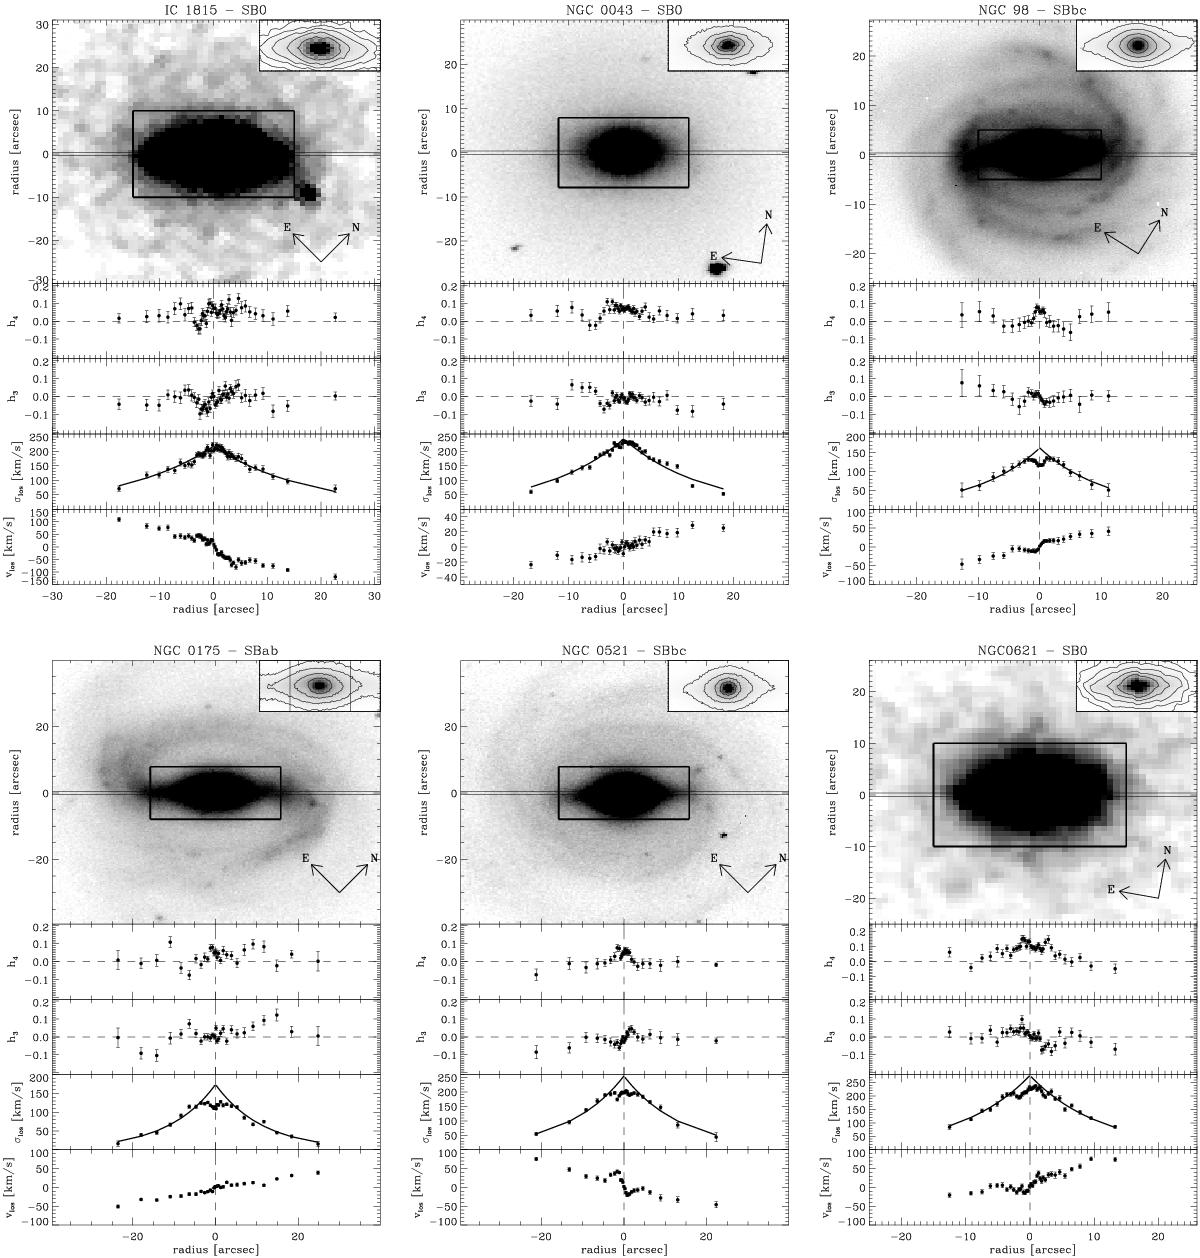
Morphology and stellar kinematics of the sample galaxies. For each galaxy the top panel shows the galaxy image. The slit position and image orientation are indicated. The inset shows the portion of the galaxy image marked with a black box. The gray scale and isophotes were chosen to enhance the features observed in the central regions. The remaining panels show from top to bottom the radial profiles of h4, h3, σlos, and velocity v (obtained by subtracting the systemic velocity from vlos). The best exponential fit to the σlos radial profile is also shown by a black solid line in the corresponding panel.
Current usage metrics show cumulative count of Article Views (full-text article views including HTML views, PDF and ePub downloads, according to the available data) and Abstracts Views on Vision4Press platform.
Data correspond to usage on the plateform after 2015. The current usage metrics is available 48-96 hours after online publication and is updated daily on week days.
Initial download of the metrics may take a while.