Fig. 8
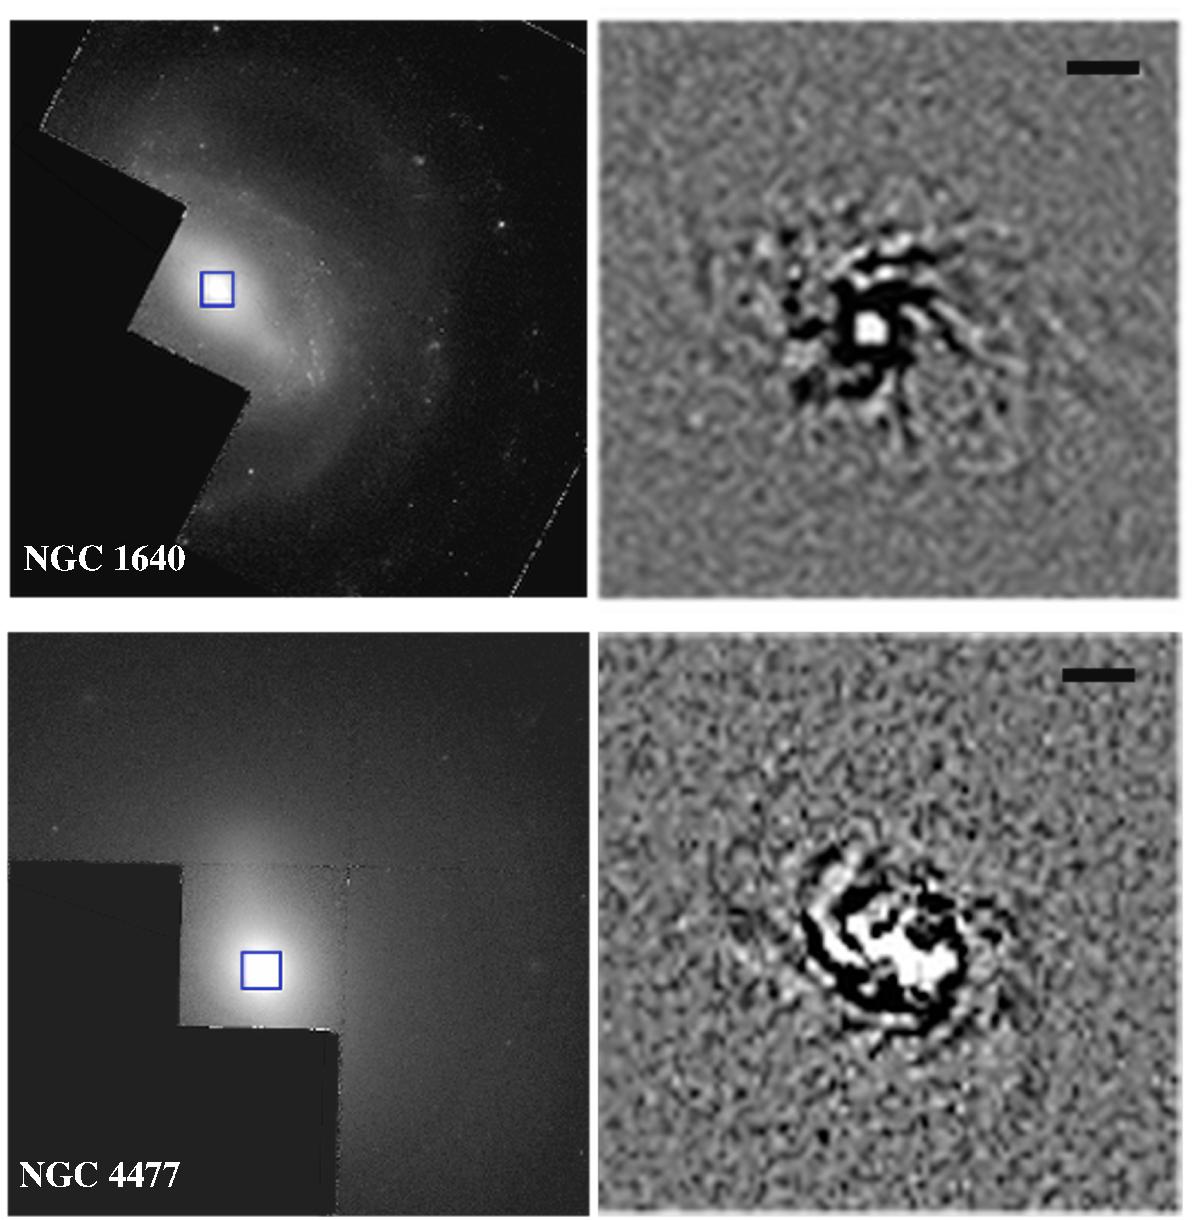
Mosaic including the HST image in the F606W band (left panels) and a zoomed unsharp image of the inner regions (right panels). Mosaics are shown for NGC 1640 (upper panels) and NGC 4477 (lower panels). The blue squares in the galaxy centers (left panels) represent the size and orientation of the unsharp masked image (right panels). The scale bars at the top represent 1′′.
Current usage metrics show cumulative count of Article Views (full-text article views including HTML views, PDF and ePub downloads, according to the available data) and Abstracts Views on Vision4Press platform.
Data correspond to usage on the plateform after 2015. The current usage metrics is available 48-96 hours after online publication and is updated daily on week days.
Initial download of the metrics may take a while.