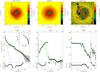
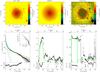
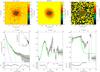
Fig. 1
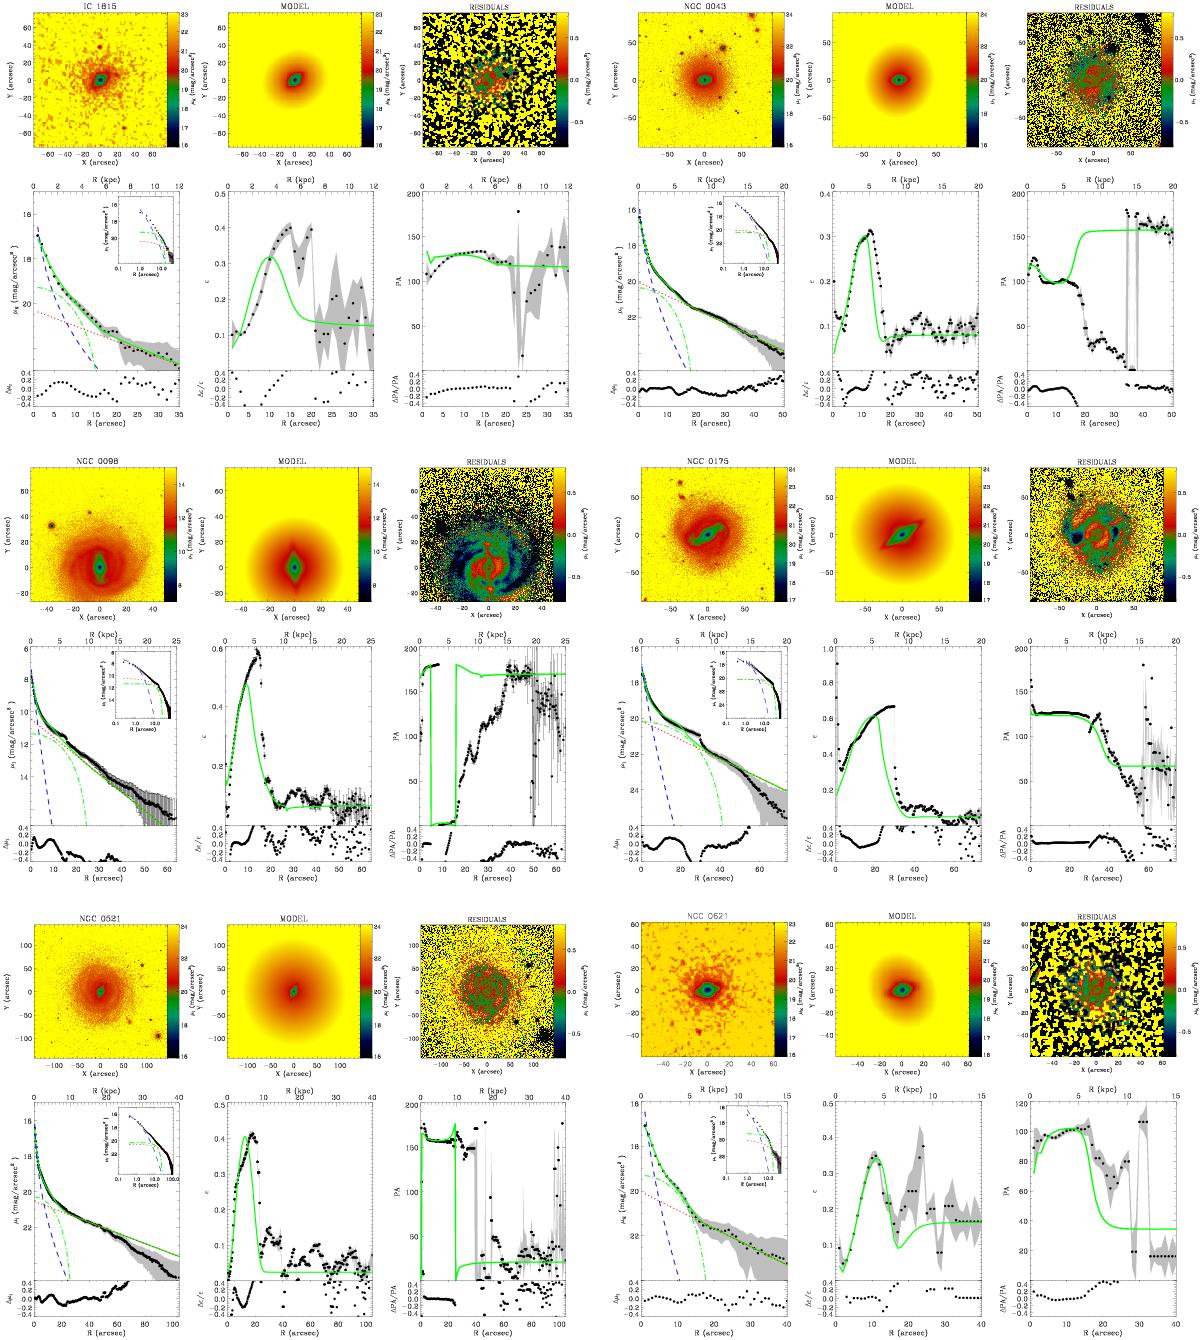
Top left: original galaxy image. Top middle: galaxy model derived from GASP2D fit considering a bulge, a bar, and a disk component. Top right: residual image derived from the subtraction of the galaxy model from the original image. Bottom left: ellipse-averaged SBD of the galaxy (black dots). Lines indicate the fit of the contribution of different components derived with GASP2D: dashed line for the bulge, dotted-dashed line for the bar, and the dotted line for the disk. The solid green line indicates the ellipse-averaged SBD of the best-fit model. Upper inset shows a zoom of the fit with a logarithmic scale for the distance to the center of the galaxy. Bottom middle: ellipticity radial profile measured from the ellipse fit on the galaxy image (black dots) and the best fit model image (green solid line). Bottom right: position angle (PA) radial profile measured from the ellipse fit on the galaxy image (black dots) and the best fit model image (green solid line).
Current usage metrics show cumulative count of Article Views (full-text article views including HTML views, PDF and ePub downloads, according to the available data) and Abstracts Views on Vision4Press platform.
Data correspond to usage on the plateform after 2015. The current usage metrics is available 48-96 hours after online publication and is updated daily on week days.
Initial download of the metrics may take a while.