Fig. 4
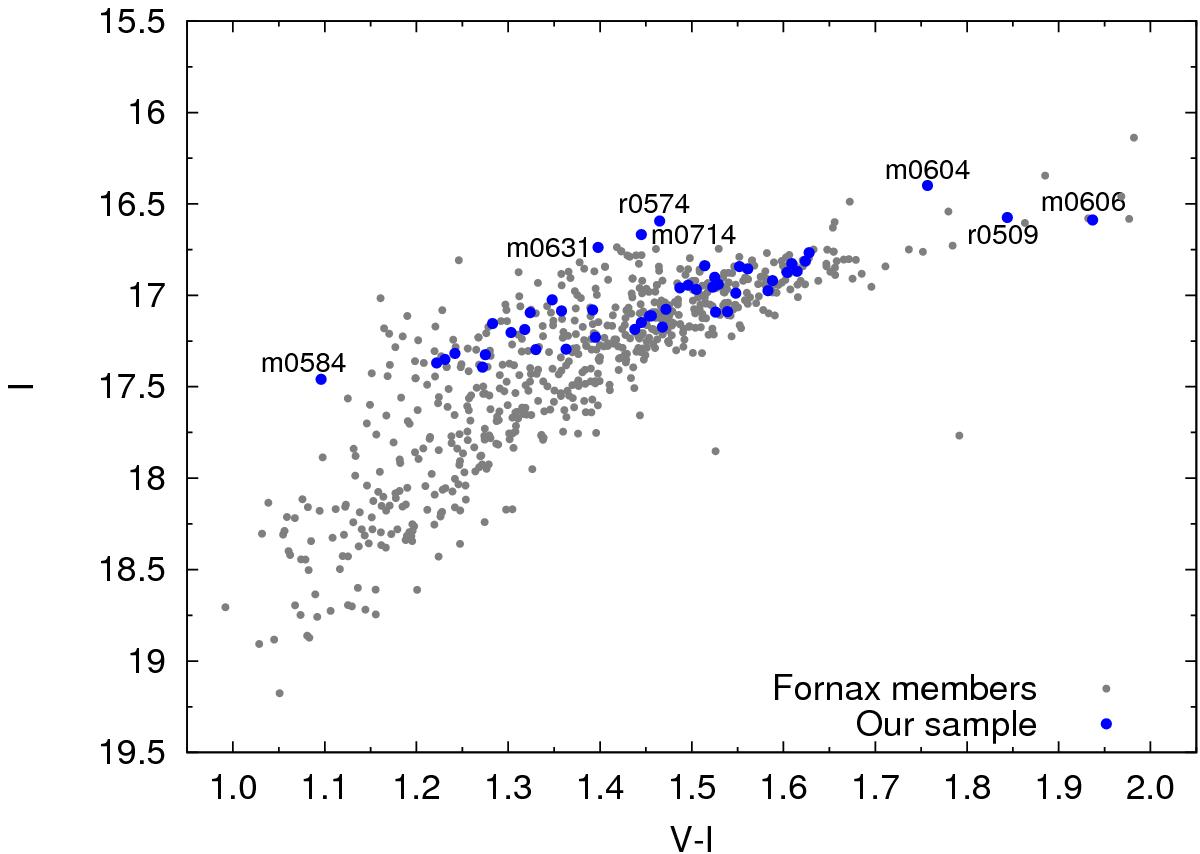
I vs. (V − I) CMD: our FLAMES/GIRAFFE sample is shown in blue dots and other Fornax members (from CaT) are shown in grey dots. Some stars located close to the tip or at the blue end of the RGB are labelled. CTIO VI photometry was provided by de Boer et al. (2012b). Data in I band are not available beyond an elliptical radius of 0.4 deg and were supplemented by ESO/WFI from Battaglia et al. (2008a).
Current usage metrics show cumulative count of Article Views (full-text article views including HTML views, PDF and ePub downloads, according to the available data) and Abstracts Views on Vision4Press platform.
Data correspond to usage on the plateform after 2015. The current usage metrics is available 48-96 hours after online publication and is updated daily on week days.
Initial download of the metrics may take a while.