Fig. 4
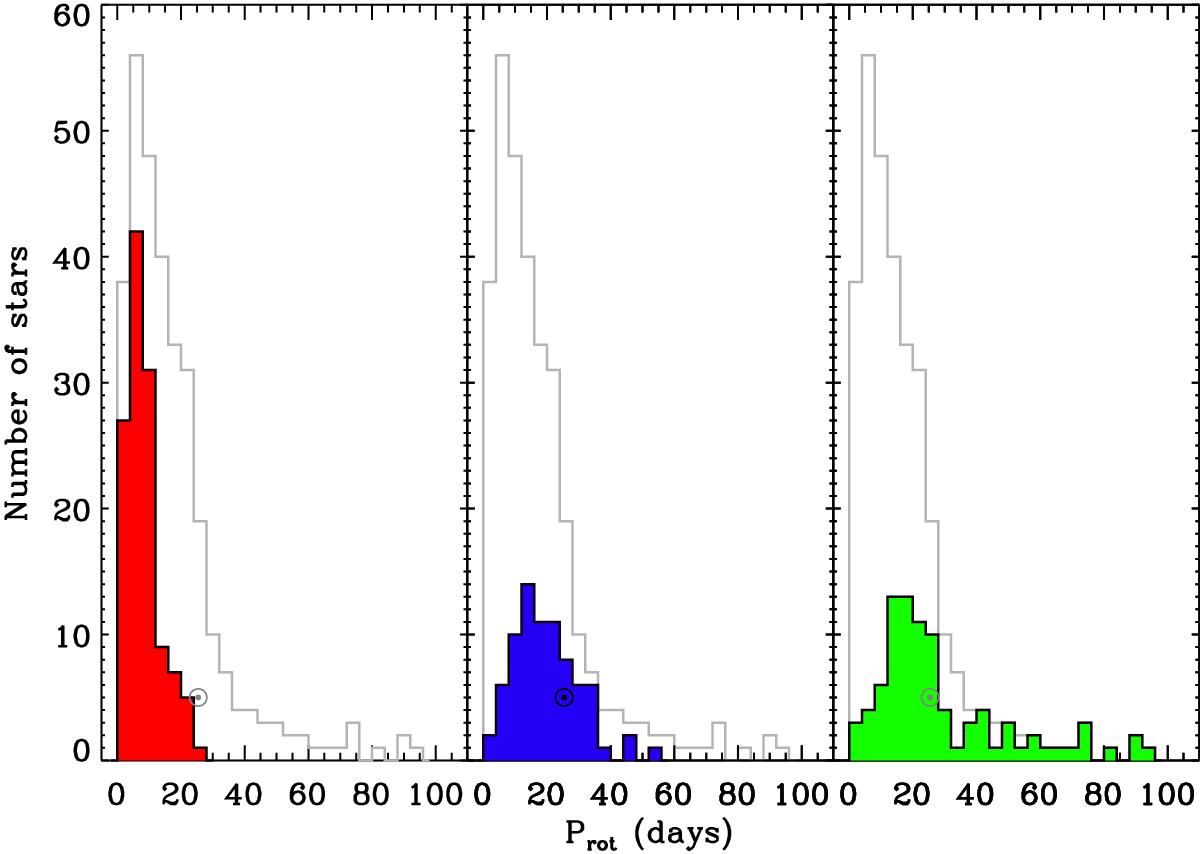
Histograms of the extracted surface rotation periods, Prot, for the full sample (grey), hot (red), dwarf (blue), and subgiant stars (green) as defined in Fig. 3. For comparison with our sample of dwarfs, the solar rotational rate (25.4 days) is represented in black in the central panel at an arbitrary Y axis of 5. In the left and right panels, the Sun is plotted in grey as guidance for the eyes only.
Current usage metrics show cumulative count of Article Views (full-text article views including HTML views, PDF and ePub downloads, according to the available data) and Abstracts Views on Vision4Press platform.
Data correspond to usage on the plateform after 2015. The current usage metrics is available 48-96 hours after online publication and is updated daily on week days.
Initial download of the metrics may take a while.