Fig. 2
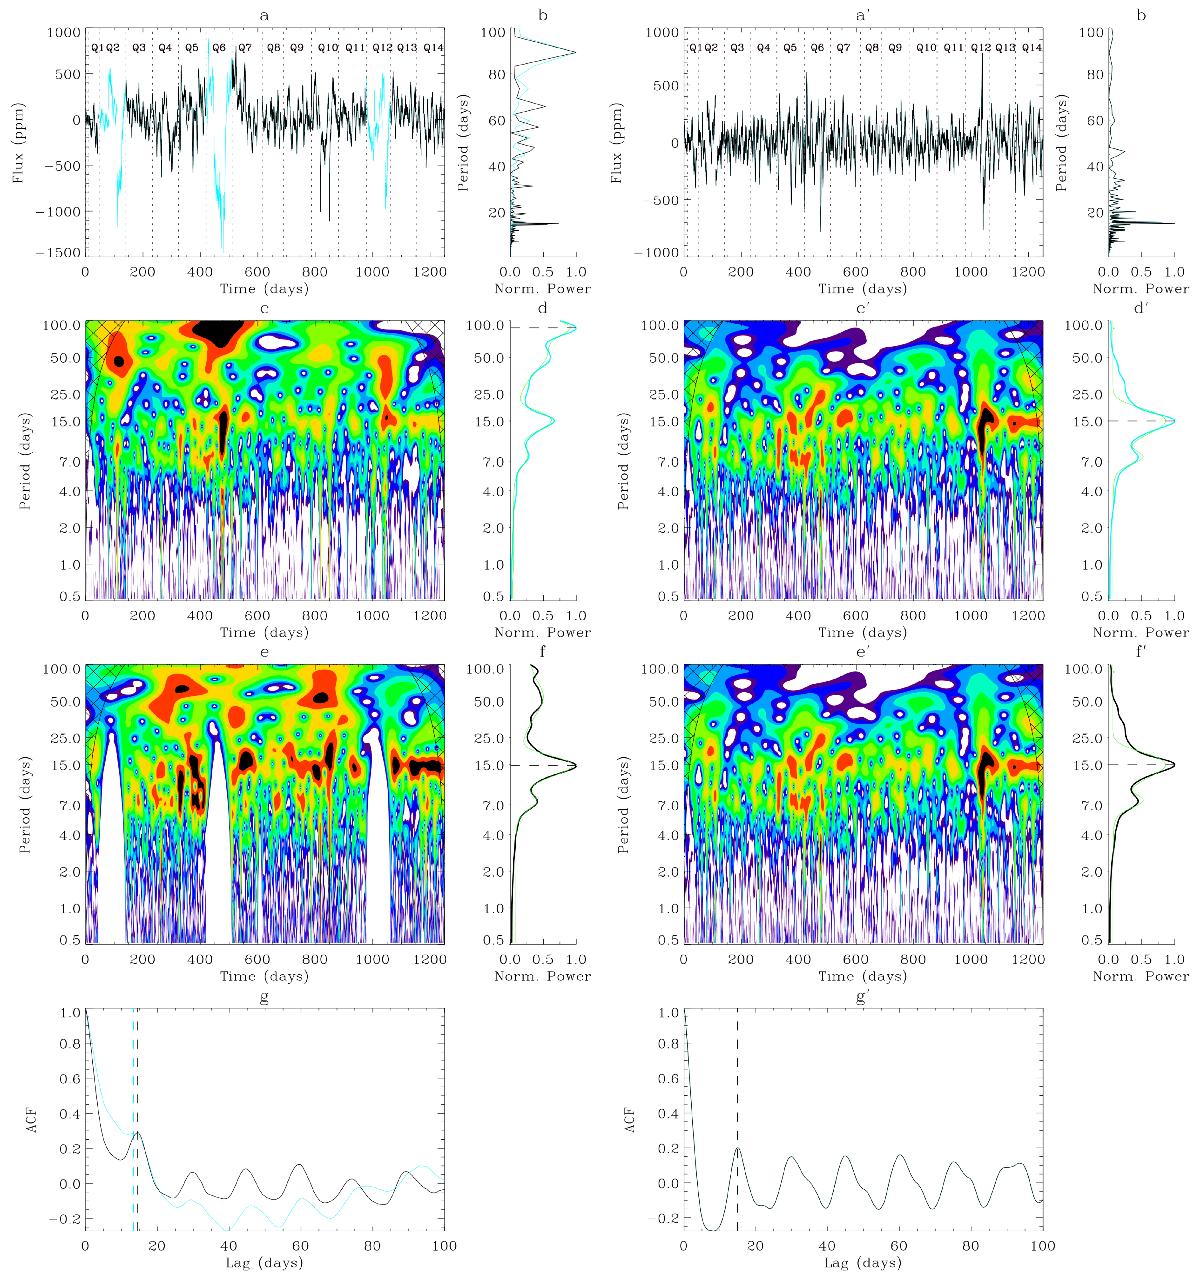
Comparison of the two analyses used in this work, ACF and GWPS, applied on the two different datasets used PDC-MAP (left-hand side panels) and KADACS (right-hand side panels marked with a prime) for KIC 12258514. For each dataset, the plots are as follows: the top panels show a) long-cadence Kepler light curves (cyan) and the quarters selected for the analysis (black), where vertical dotted lines indicate the transitions between the observing quarters. The top right panels show b) the associated power density spectrum as a function of period between 0.5 and 100 days. The middle left panels (c) and e)) depict the WPS computed using a Morlet wavelet between 0.5 and 100 days on a logarithmic scale. The c) panels correspond to the analysis of the entire light curve, while in the e) panels only the selected portions of the light curve are used in the analysis. The black-crossed area is the cone of influence corresponding to the unreliable results. The middle right panels (d) and f)) plot the GWPS as a function of the period of the wavelet (thick cyan line for d), thick black line for f)) and the associated fit composed from several Gaussian functions (thin green lines). The horizontal dashed line designates the position of the retrieved Prot. Finally, the bottom panels g) show the ACF of the full light curve plotted between 0 and 100 days (cyan) and using only the selected portions of the light curve (black). The vertical dashed line indicates the returned Prot for the ACF analysis.
Current usage metrics show cumulative count of Article Views (full-text article views including HTML views, PDF and ePub downloads, according to the available data) and Abstracts Views on Vision4Press platform.
Data correspond to usage on the plateform after 2015. The current usage metrics is available 48-96 hours after online publication and is updated daily on week days.
Initial download of the metrics may take a while.