Fig. A.2
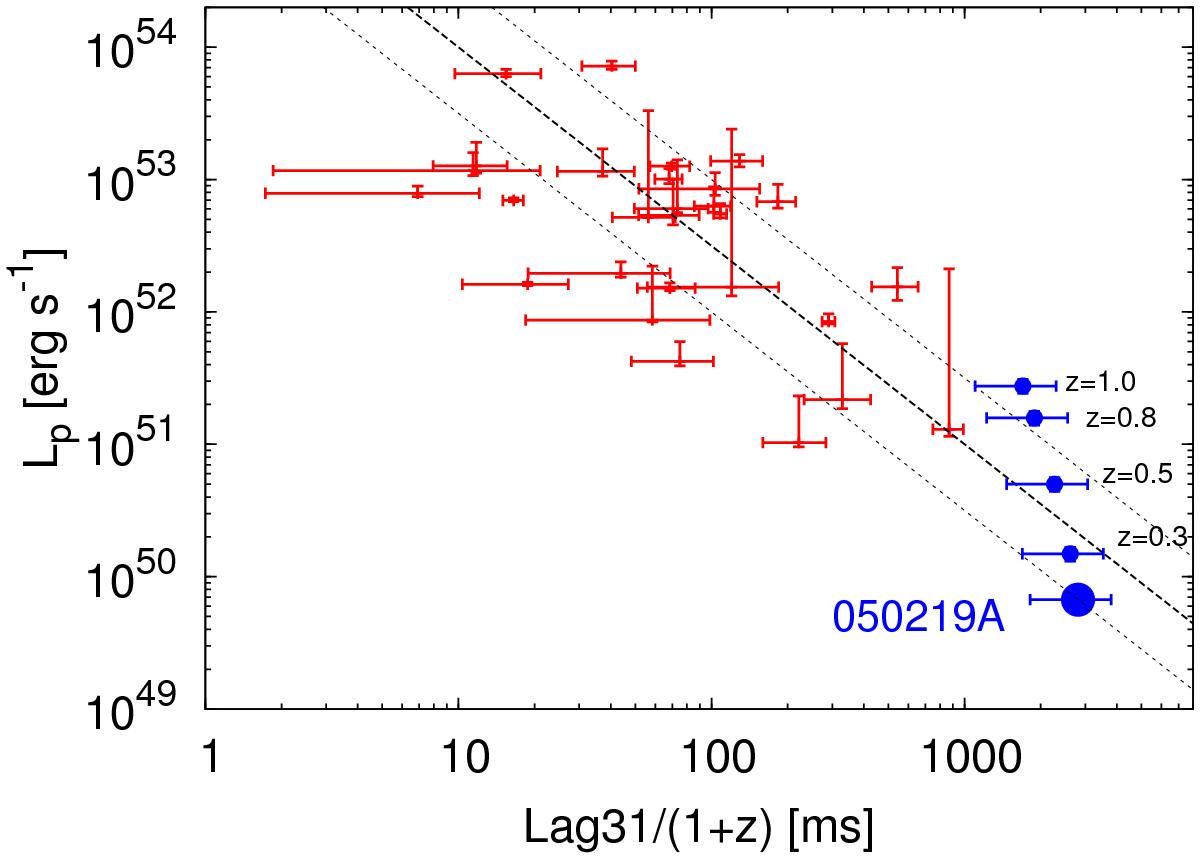
Isotropic peak luminosity as a function of spectral lag between BAT channels 3 (50–100 keV) and 1 (15–25 keV). The image is adapted from Ukwatta et al. (2010) and GRBs are marked in red. The dotted lines indicate the estimated 1σ confidence level. We marked in blue the position of GRB 050219A at different redshifts, including the redshift of the bright galaxy at z = 0.211 (bigger blue dot).
Current usage metrics show cumulative count of Article Views (full-text article views including HTML views, PDF and ePub downloads, according to the available data) and Abstracts Views on Vision4Press platform.
Data correspond to usage on the plateform after 2015. The current usage metrics is available 48-96 hours after online publication and is updated daily on week days.
Initial download of the metrics may take a while.