Fig. A.1
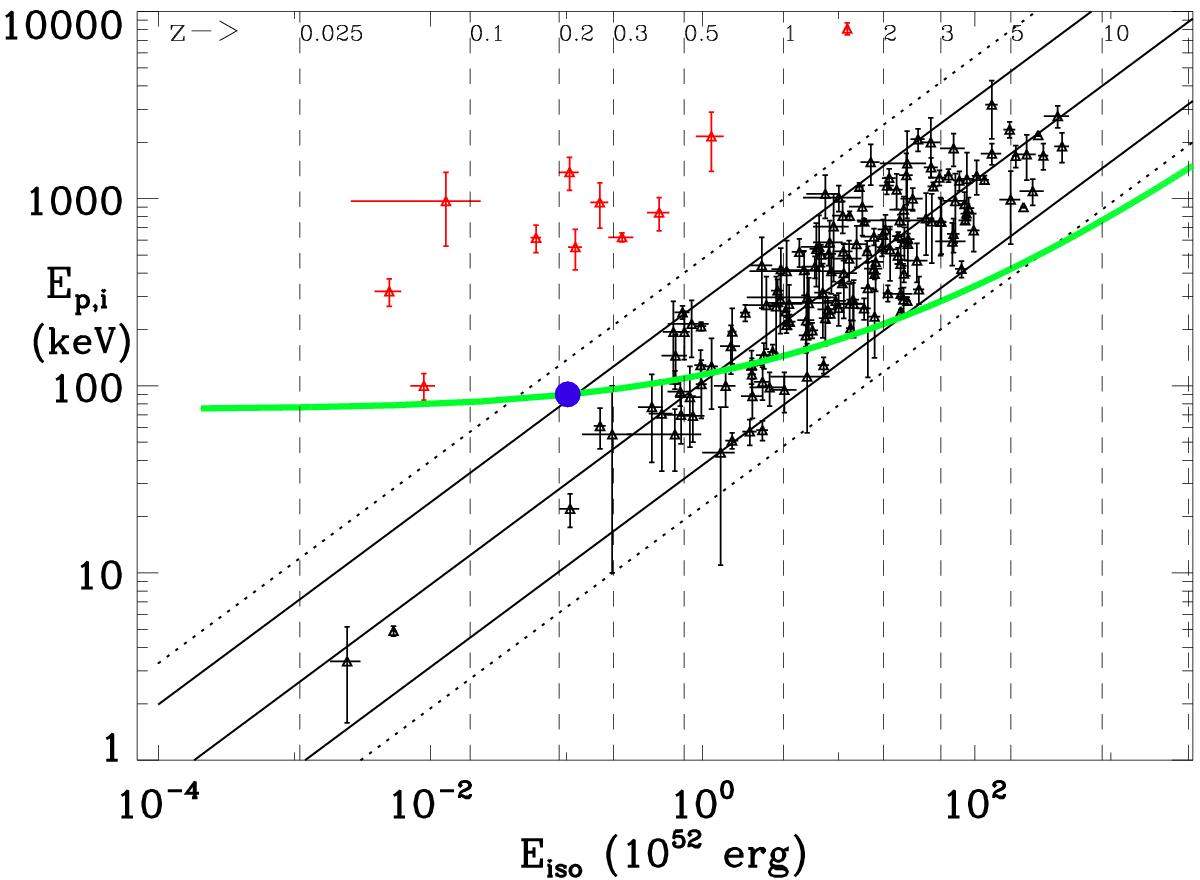
LGRBs (black) and short GRBs (red) in the Ep,i − Eiso plane. The blue dot indicates the position of GRB 050219A assuming z = 0.211. The dashed vertical lines indicate the position of the GRB at different redshifts. The green line shows how this position changes together with the redshift. The solid and dotted lines show the 2σ and 3σ regions respectively.
Current usage metrics show cumulative count of Article Views (full-text article views including HTML views, PDF and ePub downloads, according to the available data) and Abstracts Views on Vision4Press platform.
Data correspond to usage on the plateform after 2015. The current usage metrics is available 48-96 hours after online publication and is updated daily on week days.
Initial download of the metrics may take a while.