Fig. 4
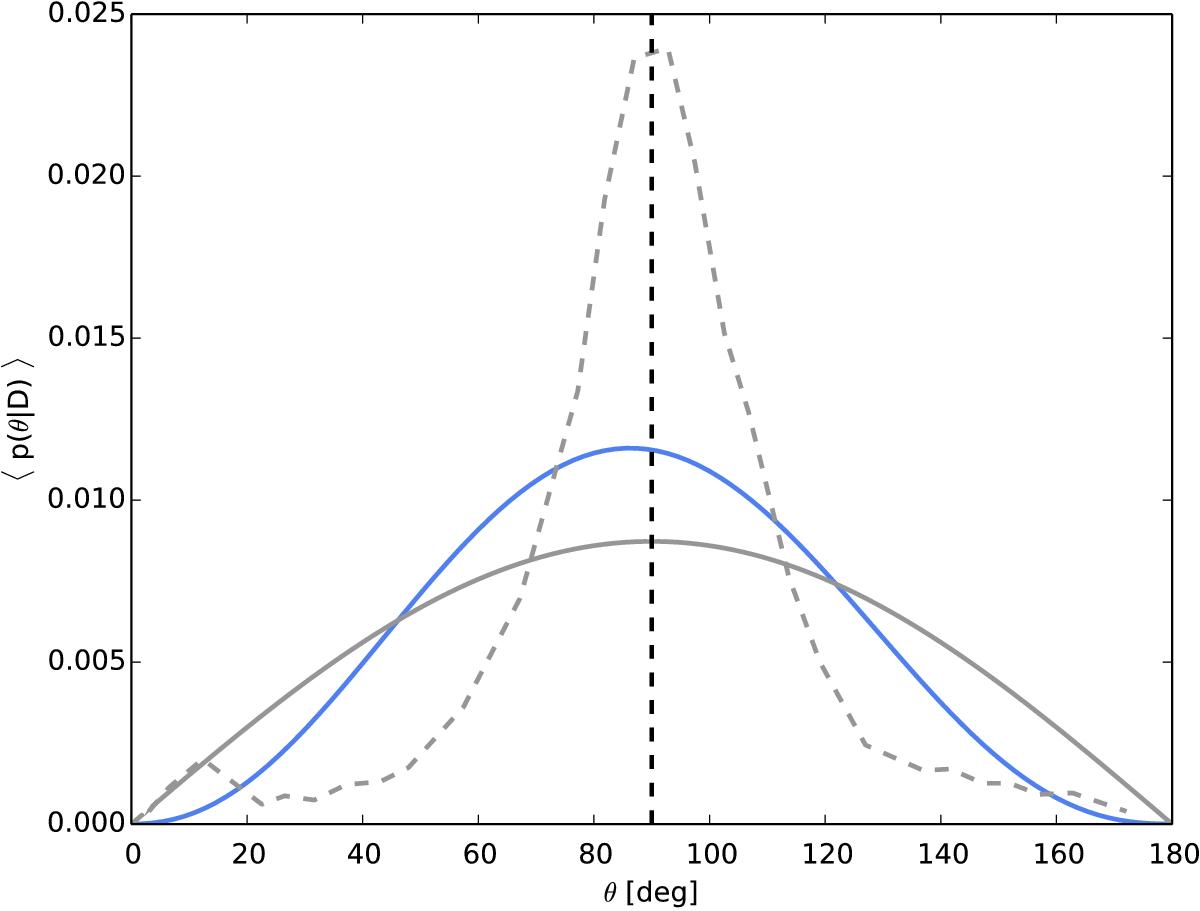
Inferred global distribution of inclinations from the data (blue), compared with the expected distribution of inclinations for an isotropic vector field (solid gray). For comparison, we have overplotted as a dashed gray line the distribution inferred by Bellot Rubio & Orozco Suárez (2012), which we obtained by scanning the original figure. For reference, the vertical dashed line indicates purely horizontal fields.
Current usage metrics show cumulative count of Article Views (full-text article views including HTML views, PDF and ePub downloads, according to the available data) and Abstracts Views on Vision4Press platform.
Data correspond to usage on the plateform after 2015. The current usage metrics is available 48-96 hours after online publication and is updated daily on week days.
Initial download of the metrics may take a while.