Fig. 2
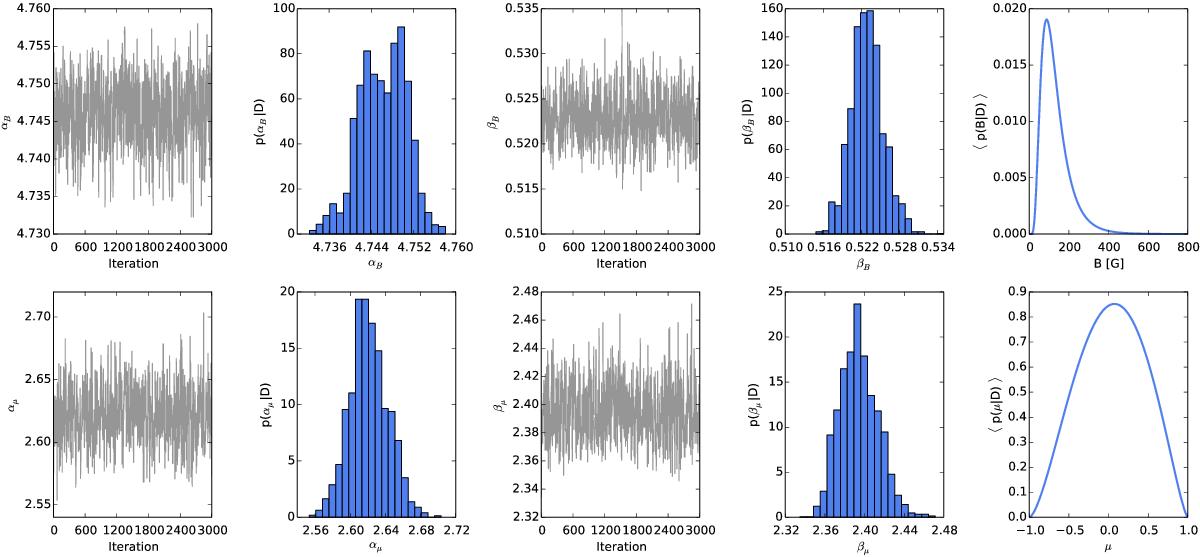
Inferred values for the hyperparameters of the priors for B (upper panels) and μ (lower panels). Columns 1 and 3 show the last 3000 samples of the Markov chains, while Cols. 2 and 4 show the associated histograms. The last column displays the Monte Carlo inferred distribution of B and μ taking into account the observations. These results are obtained with 5% of the FOV, although they remain the same as long as ~0.5% of the field of view is included in the analysis.
Current usage metrics show cumulative count of Article Views (full-text article views including HTML views, PDF and ePub downloads, according to the available data) and Abstracts Views on Vision4Press platform.
Data correspond to usage on the plateform after 2015. The current usage metrics is available 48-96 hours after online publication and is updated daily on week days.
Initial download of the metrics may take a while.