Fig. 8
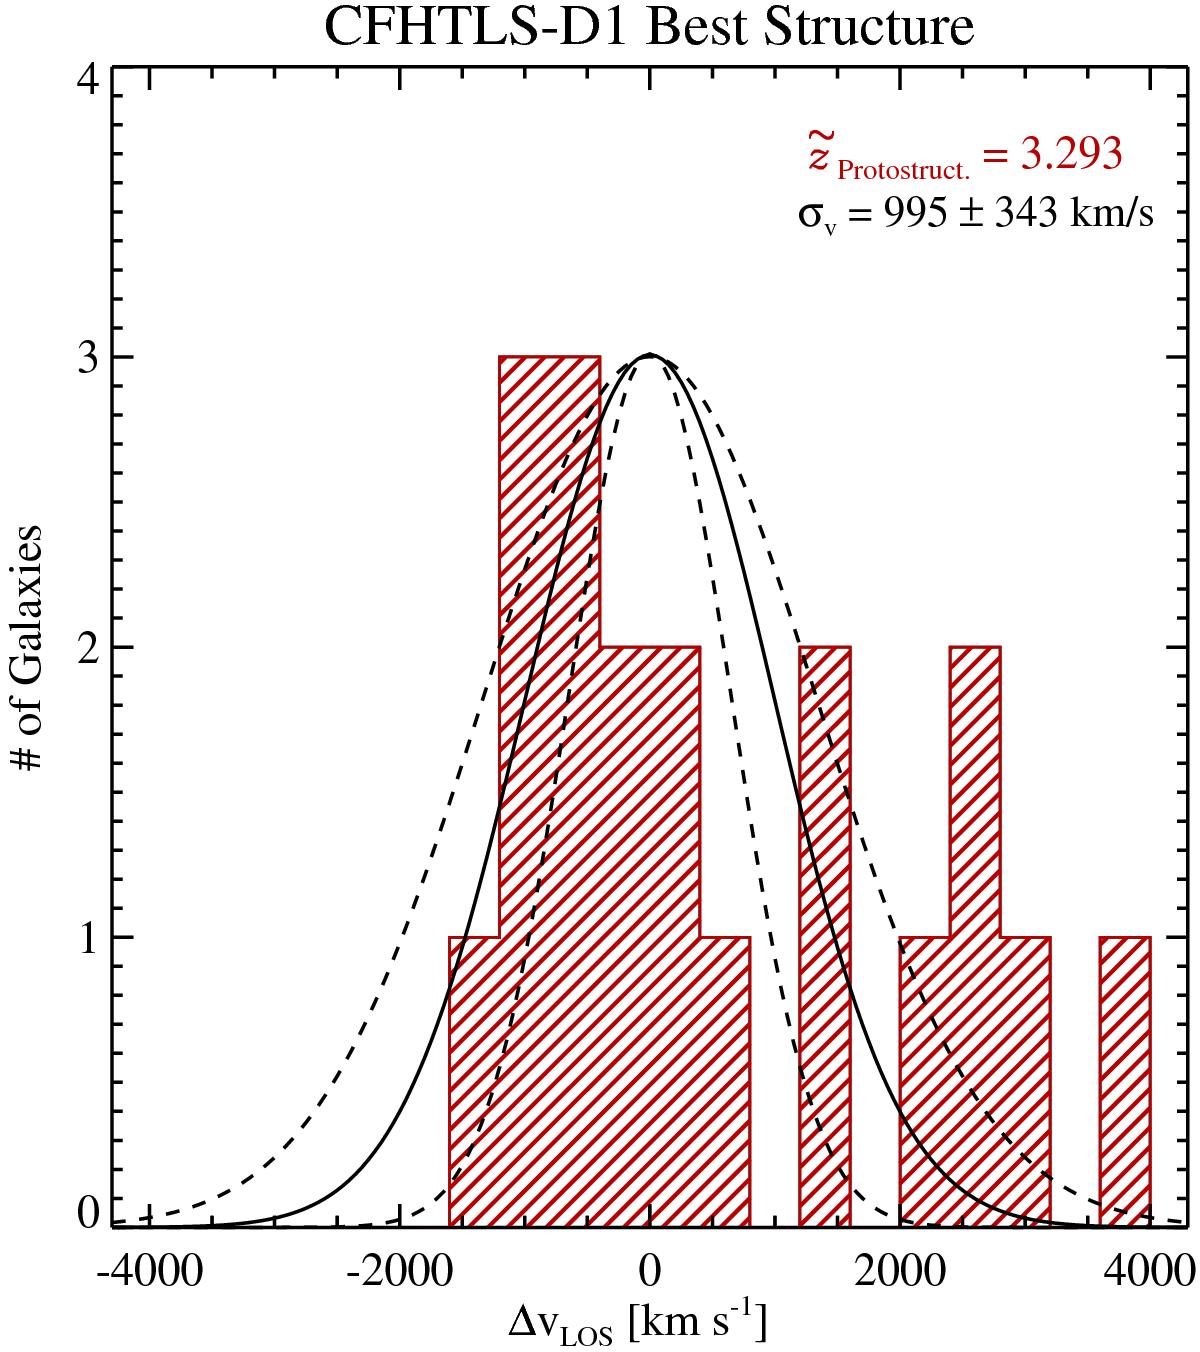
Differential velocity distribution of the all spectral members of Cl J0227-0421. The median redshift of the secure members is shown in the top right corner of the plot. Also shown in the top right corner is the value of the best-fit line of sight (LOS) velocity dispersion (σv, see Sect. 3.1 for details). The resulting Gaussian function generated by the best-fit σv is overplotted on the differential velocity histogram (solid black line) along with those functions generated from σv ± σσv. The high degree of skewness of the differential velocity distribution of member galaxies can be clearly seen.
Current usage metrics show cumulative count of Article Views (full-text article views including HTML views, PDF and ePub downloads, according to the available data) and Abstracts Views on Vision4Press platform.
Data correspond to usage on the plateform after 2015. The current usage metrics is available 48-96 hours after online publication and is updated daily on week days.
Initial download of the metrics may take a while.