Fig. A.1
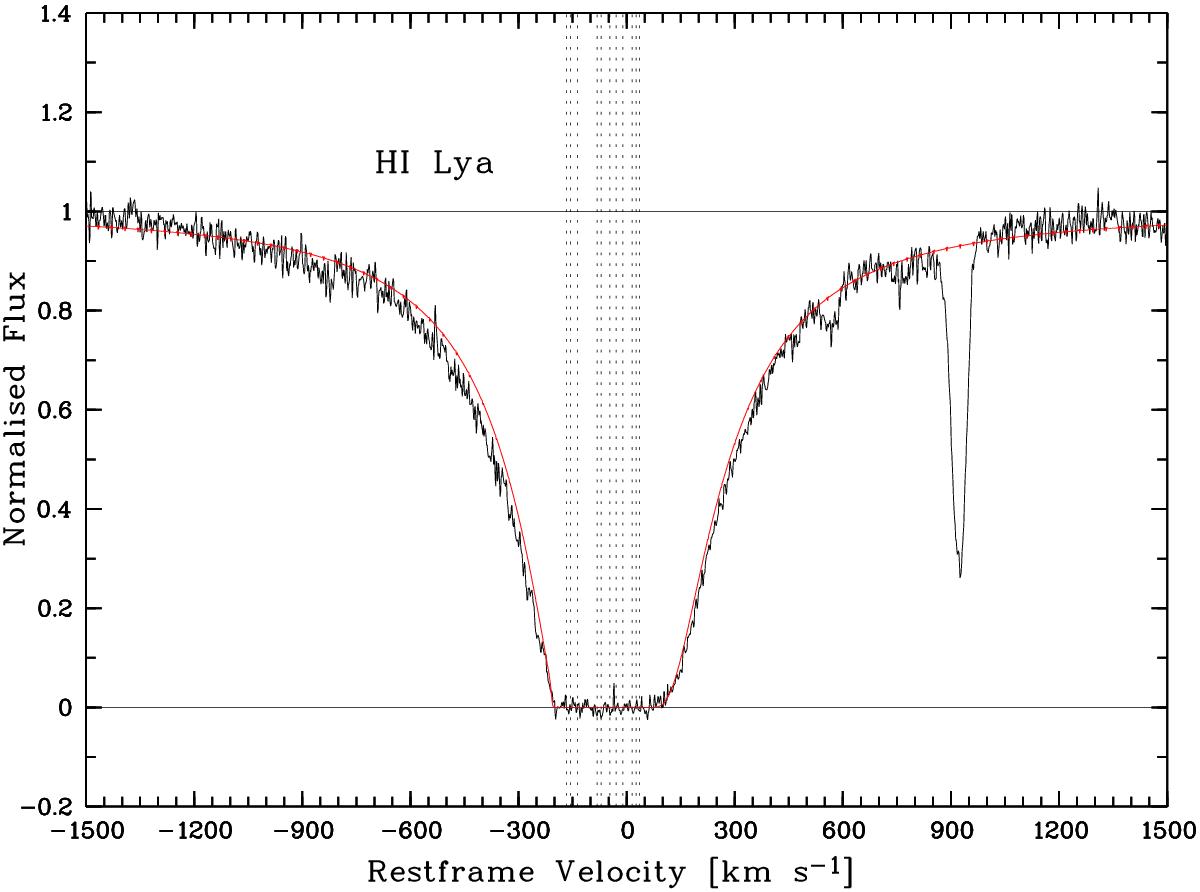
Remodelling of the hydrogen Lyman α absorption line in this absorption system. The absorption line profile is overlayed by the model (red) which is based on the measured O i column density and the assumption that [O i/H i] = − 1.56 in every component. The vertical, dotted lines indicate the velocity components of the weakly ionised metal species. The shape of the absorption line is reproduced although the outer, weaker components do not give strong constraints on N(H i).
Current usage metrics show cumulative count of Article Views (full-text article views including HTML views, PDF and ePub downloads, according to the available data) and Abstracts Views on Vision4Press platform.
Data correspond to usage on the plateform after 2015. The current usage metrics is available 48-96 hours after online publication and is updated daily on week days.
Initial download of the metrics may take a while.